PM&C’s 2018–19 financial statements are presented on pages 133–207 of this report. The Auditor-General issued an unmodified audit opinion of these statements, noting that PM&C has appropriate and effective financial controls.
Activities administered on behalf of Government
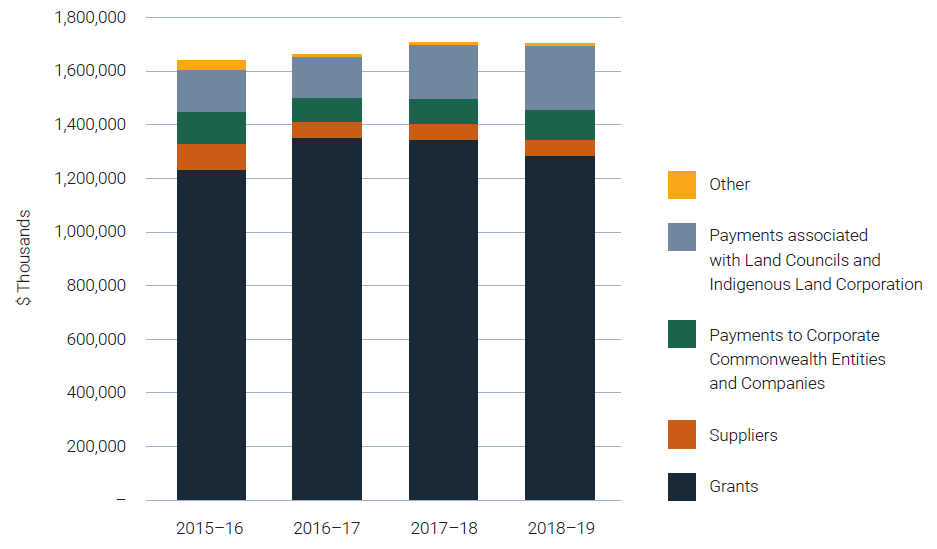
In 2018–19, PM&C administered seven programs on behalf of government. Administered expenses totalled $1,705.6 million and comprised primarily grant payments ($1,281.9 million, 75.2 per cent of the total).
Administered expenditure included:
- $1,576.0 million for Indigenous Affairs programs, of which $208.3 million was payments in relation to ABA and $53.3 million to the Indigenous Land and Sea Corporation
- $111.1 million for payments to Corporate Commonwealth entities and companies
- $18.5 million for Outcome 1 of which $4.8 million was payments for Office for Women programs.
Administered revenue totalled $75.2 million, and comprised primarily interest earned on the investment of funds held by the ABA and the Aboriginal and Torres Strait Islander Land Account (ATSILA) special accounts ($57.4 million, 76.3 per cent of the total).
As at 30 June 2019, PM&C’s administered assets totalled $3,619.7 million. Administered assets have decreased from prior years primarily due to the transfer of ATSILA to the Aboriginal and Torres Strait Islander Land and Sea Future Fund, to be managed in the Finance Portfolio.
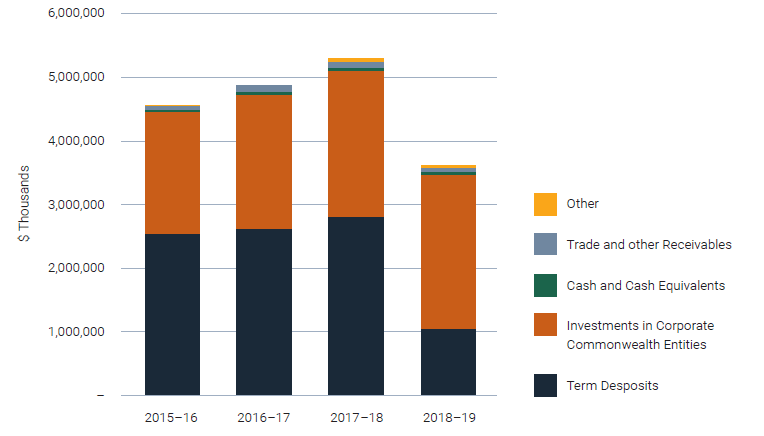
Graph 3.2: Breakdown of administered assets
As at 30 June 2019, PM&C’s administered liabilities totalled $54.8 million. This figure includes supplier and grant accruals and provision for future non-cash benefits to be provided to former Governors-General.
Departmental activities
PM&C reported an operating deficit of $26.9 million. After adjusting for unfunded depreciation and amortisation expenses and non-cash asset write-downs and impairments, PM&C recorded an operating surplus of $0.3 million.
In 2018–19 departmental expenses totalled $455.5 million.
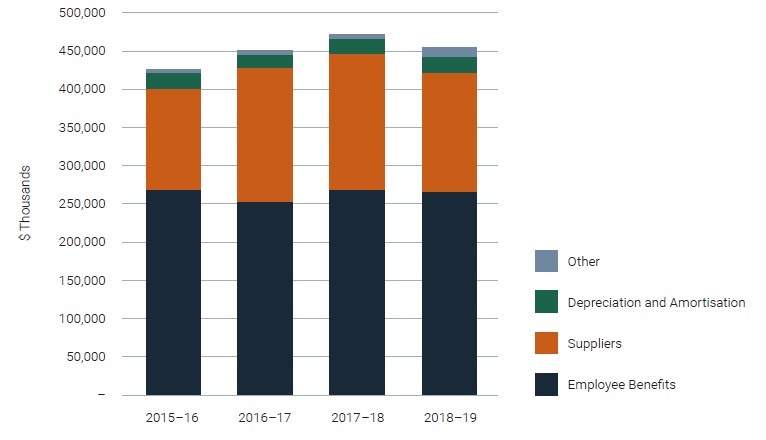
Departmental income totalled $23.7 million and comprised sale of goods / rendering of services, resources received free of charge and asset gains. Departmental expenses have decreased from 2017–18 primarily due to ceasing taskforces and a reduction in contractor expenses.
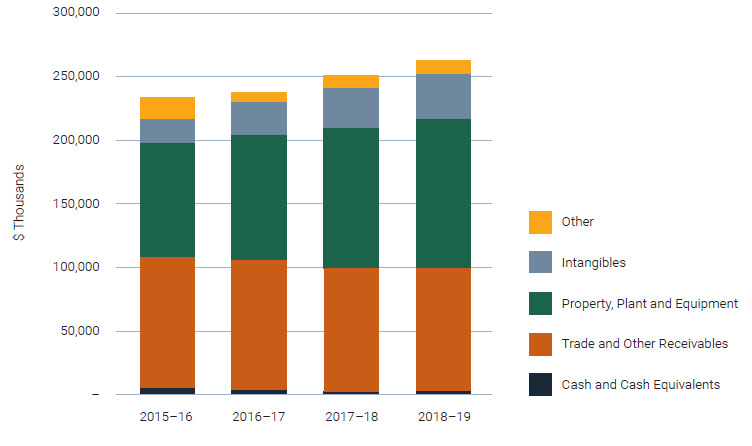
As at 30 June 2019, PM&C had a positive net asset position of $112.9 million. Assets totalled $261.9 million. PM&C’s liabilities totalled $149.0 million as at 30 June 2019, including employee provisions, supplier accruals and lease liabilities. PM&C’s assets and liabilities are broadly in line with the prior year and budgeted position.
| Actual available appropriation for 2018 – 19 | Payments made 2018 – 19 | Remaining balance 2018 – 19 | ||
|---|---|---|---|---|
|
$’000 |
$’000 |
$’000 (a)–(b) |
||
| Departmental appropriation¹,² | 537,753 | 442,747 | 95,006 | |
| Total | 537,753 | 442,747 | 95,006 | |
| Administered expenses3 | ||||
| Prior year administered appropriation | - | - | ||
| Outcome 1: Prime Minister and Cabinet | 16,183 | 15,523 | ||
| Outcome 2: Indigenous | 1,244,461 | 1,223,040 | ||
| Payments to corporate Commonwealth entities and companies4 | 111,105 | 111,105 | ||
| Total | 1,371,749 | 1,349,668 | ||
| Total ordinary annual services | A | 1,909,502 | 1,792,415 | |
| Other services5 | ||||
| Administered expenses | ||||
| Specific payments to states, ACT, NT and local government | ||||
| Prior year administered appropriation | ||||
| Outcome 1: Prime Minister and Cabinet | ||||
| Outcome 2: Indigenous | 6,536 | 6,536 | ||
| Total | 6,536 | 6,536 | ||
| Departmental non-operating | ||||
| Equity injections6 | 14,854 | 7,791 | 7,063 | |
| Total | 14,854 | 7,791 | 7,063 | |
| Administered non-operating | ||||
| Administered assets and liabilities | ||||
| Payments to corporate Commonwealthentities and companies non-operating | 24,913 | 24,913 | ||
| Total | 24,913 | 24,913 | ||
| Total other services | B | 46,303 | 39,240 | |
| Total available annual appropriations and payments | A+B | 1,955,805 | 1,831,655 | |
| Special appropriations | ||||
| Special appropriations limited by criteria/entitlement | ||||
| Aboriginal Land Rights (Northern Territory) Act 1976 | 430,627 | |||
| Higher Education Support Act 2003 | 69,135 | |||
| Special appropriations limited by amount | ||||
| Public Governance, Performance and Accountability Act 2013 | ||||
| Total special appropriations | C | 499,762 | ||
| Special accounts7 | ||||
| Opening balance | 23,496 | |||
| Appropriation receipts | 458,108 | |||
| Non-appropriation receipts to special accounts | 2,628,945 | |||
| Payments made | 3,072,771 | |||
| Total special accounts | D | 3,110,549 | 3,072,771 | 37,778 |
| Total resourcing and payments | ||||
| A+B+C+D | 5,066,354 | 5,404,188 | ||
|
Less appropriations drawn from annual or special appropriations above and credited to special accounts and/or corporate Commonwealth entities and companies through annual appropriations |
(594,126) | (594,126) | ||
| Total net resourcing and payments for PM&C | 4,472,228 | 4,801,062 |
- Appropriation Act (No. 1) 2018–19, including prior year departmental appropriation and section 74 retained revenue receipts, less permanent quarantines of $1.190 million and section 75 transfers of $1.237 million. For further details refer to Note 5.1 to the financial statements.
- Includes an amount of $12.146 million in 2018–19 for the departmental capital budget. For accounting purposes, this amount has been designated as ‘contributions by owners’.
- Includes an amount of $1.276 million in 2018–19 for the administered capital budget; and $2.513 million of section 51 quarantines. For accounting purposes, this amount has been designated as ‘contributions by owners’.
- Corporate Commonwealth entities are corporate Commonwealth entities and Commonwealth companies as defined under the Public Governance, Performance and Accountability Act 2013 (PGPA Act).
- Appropriation Act (No. 2) 2018–19.
- Appropriation Act (No. 2) 2018–19 equity injections and prior year equity injections.
- Does not include special public money held in accounts like Services for Other Entities and Trust Moneys special accounts (SOETM)
Expenses for Outcome 1
Outcome 1: Provide high-quality policy advice and support to the Prime Minister, the Cabinet, portfolio ministers and parliamentary secretaries, including through the coordination of government activities, policy development, and program delivery.
|
|
Budget* 2018–19 |
Actual Expenses 2018–19 |
Variation 2018–19 |
|---|---|---|---|
|
|
$’000 |
$’000 |
$’000 |
|
Program 1.1: Prime Minister and Cabinet |
|
|
|
|
Administered expenses |
|
|
|
|
Ordinary annual services (Appropriation Acts Nos 1, 3 and 5) |
16,898 |
14,282 |
2,616 |
|
Special appropriations |
– |
– |
– |
|
Expenses not requiring appropriation in the Budget year2 |
2,728 |
4,227 |
(1,499) |
|
Departmental expenses |
|
|
|
|
Departmental appropriation1 |
152,267 |
150,974 |
1,293 |
|
Expenses not requiring appropriation in the Budget year2 |
10,349 |
11,072 |
(723) |
|
Total for Program 1.1 |
182,242 |
180,555 |
1,687 |
|
Outcome 1 Totals by appropriation type |
|
|
|
|
Administered expenses |
|
|
|
|
Ordinary annual services (Appropriation Act No. 1) |
16,898 |
14,282 |
2,616 |
|
Special appropriations |
– |
– |
– |
|
Expenses not requiring appropriation in the Budget year2 |
2,728 |
4,227 |
(1,499) |
|
Departmental expenses |
|
|
|
|
Departmental appropriation1 |
152,267 |
150,974 |
1,293 |
|
Expenses not requiring appropriation in the Budget year2 |
10,349 |
11,072 |
(723) |
|
Total expenses for Outcome 1 |
182,242 |
180,555 |
(1,687) |
| Average staffing level (number) | 609 | 642 | (33) |
* Full year budget, including any subsequent adjustment made.
- Departmental appropriation combines ordinary annual services (Appropriation Acts Nos 1 and 3) and Retained Revenue Receipts under section 74 of the PGPA Act.
- Expenses not requiring appropriation in the Budget year are made up of depreciation and amortisation expenses, impairment of receivables, make-good expense, audit fees and services provided free of charge.
Expenses for Outcome 2
Outcome 2: Improve results for Indigenous Australians including in relation to school attendance, employment and community safety, through delivering services and programs, and through measures that recognise the special place that Indigenous people hold in this nation.
|
|
Budget* 2018–19 |
Actual Expenses 2018–19 |
Variation 2018–19 |
|---|---|---|---|
|
|
$’000 |
$’000 |
$’000 |
|
Program 2.1: Jobs, Land and Economy |
|
|
|
|
Administered expenses |
|
|
|
|
Ordinary annual services (Appropriation Act No. 1)3 |
658,894 |
620,190 |
38,704 |
|
Special appropriations |
441,021 |
430,627 |
10,394 |
|
Special accounts |
284,939 |
258,859 |
26,080 |
|
Payments to corporate entities |
18,511 |
18,511 |
– |
|
Less expenses made from appropriations credited to special accounts |
(440,000) |
(429,608) |
(10,392) |
|
Expenses not requiring appropriation in the Budget year2 |
– |
1,535 |
(1,535) |
|
Total for Program 2.1 |
963,365 |
900,114 |
63,251 |
|
Program 2.2: Children and Schooling |
|
|
|
|
Administered expenses |
|
|
|
|
Ordinary annual services (Appropriation Act No. 1)3 |
219,000 |
248,805 |
(29,805) |
|
Other services (Appropriation Act No. 2) |
6,536 |
6,536 |
– |
|
Special appropriations |
69,136 |
69,135 |
1 |
|
Expenses not requiring appropriation in the Budget year2 |
– |
404 |
(404) |
|
Total for Program 2.2 |
294,672 |
324,880 |
(30,208) |
|
Program 2.3: Safety and Wellbeing |
|
|
|
|
Administered expenses |
|
|
|
|
Ordinary annual services (Appropriation Act No. 1)2 |
245,311 |
260,101 |
(14,790) |
|
Special accounts |
– |
118 |
(118) |
|
Payments to corporate entities |
36,323 |
36,323 |
– |
|
Expenses not requiring appropriation in the Budget year2 |
– |
30 |
(30) |
|
Total for Program 2.3 |
281,634 |
296,572 |
(14,938) |
|
Program 2.4: Culture and Capability |
|
|
|
|
Administered expenses |
|
|
|
|
Ordinary annual services (Appropriation Act No. 1)2 |
48,396 |
48,165 |
231 |
|
Payments to corporate entities |
20,388 |
20,388 |
– |
|
Expenses not requiring appropriation in the Budget year |
– |
126 |
(126) |
|
Total for Program 2.4 |
68,784 |
68,679 |
105 |
|
Program 2.5: Remote Australia Strategies |
|
|
|
|
Administered expenses |
|
|
|
|
Ordinary annual services (Appropriation Act No. 1)3 |
66,975 |
62,306 |
4,669 |
|
Special accounts |
22,000 |
15,709 |
6,291 |
|
Payments to corporate entities |
35,883 |
35,883 |
– |
|
Less expenses made from appropriations credited to special accounts |
– |
(28,500) |
28,500 |
|
Expenses not requiring appropriation in the Budget year2 |
– |
(3) |
3 |
|
Total for Program 2.5 |
124,858 |
85,395 |
39,463 |
|
Program 2.6: Evaluation and Research |
|
|
|
|
Administered expenses |
|
|
|
|
Ordinary annual services (Appropriation Act No. 1)3 |
12,487 |
11,421 |
1,066 |
|
Expenses not requiring appropriation in the Budget year2 |
– |
– |
– |
|
Total for Program 2.5 |
12,487 |
11,421 |
1,066 |
|
Program 2.7: Program Support |
|
|
|
|
Departmental expenses |
|
|
|
|
Departmental appropriation1 |
273,341 |
271,296 |
2,045 |
|
Expenses not requiring appropriation in the Budget year3 |
11,103 |
22,181 |
(11,078) |
|
Total for Program 2.6 |
284,444 |
293,477 |
(9,033) |
|
Outcome 2 Totals by appropriation type |
|
|
|
|
Administered expenses |
|
|
|
|
Ordinary annual services (Appropriation Act No. 1) |
1,251,063 |
1,250,988 |
75 |
|
Other services (Appropriation Act No. 2) |
6,536 |
6,536 |
– |
|
Special appropriations |
510,157 |
499,762 |
10,395 |
|
Special accounts |
306,939 |
274,686 |
32,254 |
|
Payments to corporate entities |
111,105 |
111,105 |
– |
|
Expenses not requiring appropriation in the Budget year2 |
– |
2,092 |
(2,092) |
|
Less expenses made from appropriations credited to special accounts |
(440,000) |
(458,108) |
18,108 |
|
Departmental expenses |
|
|
|
|
Departmental appropriation1 |
273,341 |
271,296 |
2,045 |
|
Expenses not requiring appropriation in the Budget year2 |
11,103 |
22,181 |
(11,078) |
|
Total expenses for Outcome 2 |
2,030,244 |
1,980,538 |
49,706 |
| Average staffing level (number) | 1,448 | 1,248 | 200 |
* Full year budget, including any subsequent adjustment made.
- Departmental appropriation combines ordinary annual services (Appropriation Acts No. 1 and 3) and retained revenue receipts under section 74 of the PGPA Act.
- Expenses not requiring appropriation in the Budget year is made up of depreciation and amortisation expenses, impairment of receivables, valuation of employee provisions, make good expense, audit fees and other non-cash expense items.
- The variances in administered Outcome 2 programs in 'Ordinary annual services' relates to the transfer of funding between programs. These transfers were approved by the Minister for Indigenous Affairs and the Minister for Finance (where required).