
PM&C’s 2017–18 financial statements are presented in part four of this report. The ANAO issued an unmodified audit opinion of these statements, noting that PM&C has appropriate and effective financial controls.
Activities administered on behalf of government
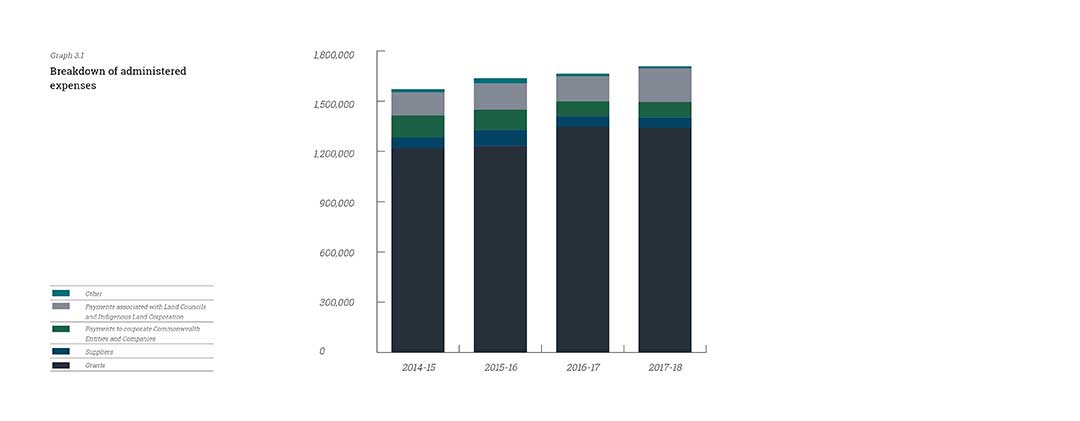
In 2017–18 PM&C administered seven programs on behalf of government. Administered expenses totalled $1,707.6 million and comprised primarily grant payments ($1,340.9 million, 78.5 per cent of the total).
Administered expenditure included:
- $1,585.1 million for Indigenous Affairs programs
- $183.6 million for payments in relation to the Aboriginals Benefit Account (ABA)
- $52.7 million for payments in relation to the Aboriginal and Torres Strait Islander Land Account (ATSILA)
- $3.0 million for Office for Women programs.
Administered revenue totalled $91.1 million and comprised primarily interest earned on the investment of funds held by the ABA and the ATSILA special accounts ($72.4 million, 79.5 per cent of the total).
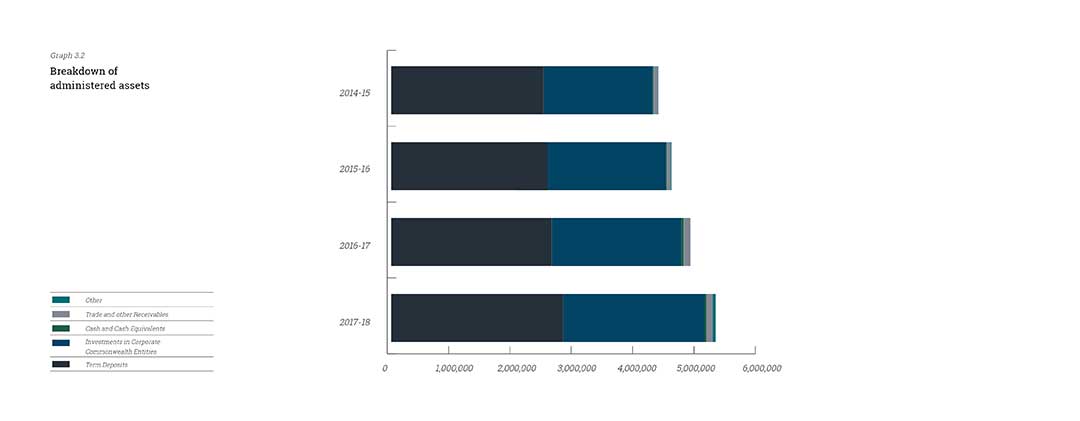
As at 30 June 2018, PM&C’s administered assets totalled $5,288.1 million. Administered assets have increased from the prior year due to an increase in term deposit balances and an increase in investments in PM&C portfolio entities following increases to their net asset positions.
As at 30 June 2018, PM&C’s administered liabilities totalled $67.2 million. This figure includes supplier and grant accruals and provision for future non-cash benefits to be provided to former Governors-General.
Departmental activities
PM&C reported a technical operating deficit of $24.0 million. After adjusting for unfunded depreciation and amortisation expenses and non-cash asset write-downs and impairments, PM&C recorded an operating surplus of $2.2 million.
In 2017–18 departmental expenses totalled $473.4 million.
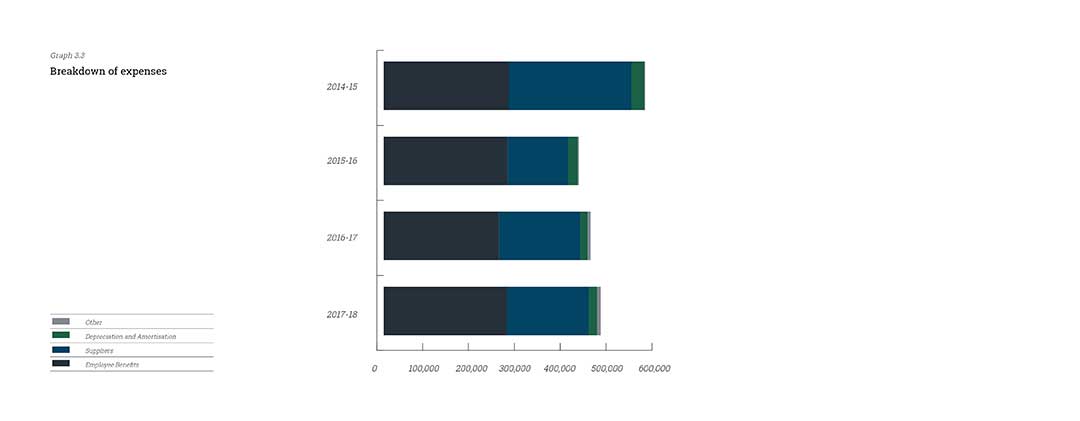
Departmental income totalled $31.9 million and comprised sale of goods/rendering of services, resources received free of charge and asset gains. Departmental income and expenses have increased from 2016–17 primarily due to a gain on early termination of leased accommodation.
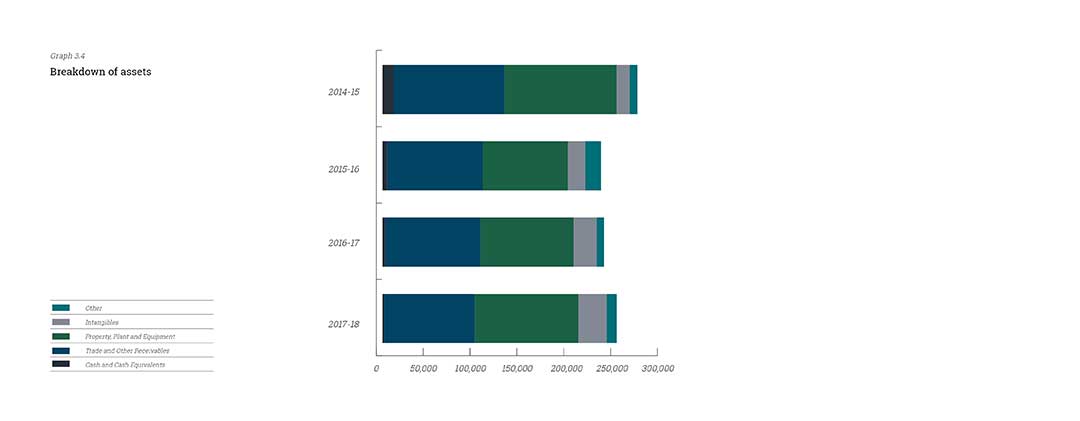
As at 30 June 2018, PM&C had a positive net asset position of $111.6 million. Assets totalled $250.1 million. PM&C’s liabilities totalled $138.5 million as at 30 June 2018, including employee provisions, supplier accruals and lease liabilities. PM&C’s assets and liabilities are in line with the prior year and budgeted position.
| Actual Available Appropriation for 2017-18 $'000 (A) |
Payments made 2017-18 $'000 (B) |
Remaining balance 2017-18 $'000 (A)-(B) |
||
|---|---|---|---|---|
| Departmental appropriation 1, 2 | 547,596 | 470,695 | 76,901 | |
| Total | 547,596 | 470,695 | 76,901 | |
| Administered Expenses 3 | ||||
| Prior year administered appropriation | 47,384 | 47,384 | ||
| Outcome 1: Prime Minister and Cabinet | 31,340 | 29,557 | ||
| Outcome 2: Indigenous | 1,275,733 | 1,223,632 | ||
| Payments to corporate Commonwealth entities and companies 4 | 94,929 | 94,929 | ||
| Total | 1,449,386 | 1,395,502 | ||
| Total ordinary annual services | A | 1,996,982 | 1,866,197 | |
| Other services 5
|
||||
| Administered expenses | ||||
| Specific payments to states, ACT, NT and local government | ||||
| Outcome 2: Indigenous | 7,762 | 7,762 | ||
| Total | 7,762 | 7,762 | ||
| Departmental non-operating | ||||
| Equity injections 6 | 16,246 | 9,665 | 6,581 | |
| Total | 16,246 | 9,665 | 6,581 | |
| Administered non-operating | ||||
| Administered assets and liabilities | ||||
| Payments to corporate Commonwealth entities and companies - non-operating | 23,850 | 23,850 | ||
| Total | 23,850 | 23,850 | ||
| Total other services | B | 47,858 | 41,277 | |
| Total available annual appropriations and payments | A+B | 2,044,840 | 1,907,474 | |
| Special appropriations | ||||
| Special appropriations limited by criteria/entitlement | ||||
| Aboriginal Land Rights (Northern Territory) Act 1976 | 338,702 | |||
| Higher Education Support Act 2003 | 67,979 | |||
| Special appropriations limited by amount | ||||
| Public Governance, Performance and Accountability Act 2013 | 50 | |||
| Total special appropriations | C | 406,731 | ||
| Special accounts 7 | ||||
| Opening balance | 35,768 | |||
| Appropriation receipts | 347,951 | |||
| Non-appropriation receipts to special accounts | 2,771,882 | |||
| Payments made | 3,1132,104 | |||
| Total special accounts | D | 3,155,601 | 3,132,104 | 23,497 |
| Total resourcing and payments | ||||
| A+B+C+D | 5,200,441 | 5,446,309 | ||
| Less appropriations drawn from annual or special appropriations above and credited to special accounts and/or corporate Commonwealth entities and companies through annual appropriations | (466,730) | (466,730) | ||
| Total net resourcing and payments for PM&C | 4,733,711 | 4,979,579 | ||
1 Appropriation Act (No. 1) 2017–18 including prior year departmental appropriation and section 74 retained revenue receipts, less permanent quarantines of $26.473 million and S75 transfers of $11.072 million. For further details refer to Note 5.1 to the financial statements.
2 Includes an amount of $12.311 million in 2017–18 for the Departmental Capital Budget.
3 Includes $0.3 million in 2017–18 for the Administered Capital Budget, and $48.8 million of permanent quarantines pending formal repeal.
4 Corporate Commonwealth entities are corporate Commonwealth entities and Commonwealth companies as defined under the Public Governance, Performance and Accountability Act 2013 (PGPA Act).
5 Appropriation Act (No. 2) 2017–18.
6 Appropriation Act (No. 2) 2017–18 equity injections and prior year equity injections.
7 Does not include special public money held in accounts like Services for Other Entities and Trust Moneys Special Accounts (SOETM).
| Outcome 1: Provide high-quality policy advice and support to the Prime Minister, the Cabinet, portfolio ministers and parliamentary secretaries including through the coordination of government activities, policy development and program delivery. | Budget* 2017-18 $'000 (A) |
Actual expenses 2017-18 $'000 (B) |
Variation 2017-18 $'000 (A)-(B) |
|---|---|---|---|
| Program 1.1: Prime Minister and Cabinet | |||
| Administered expenses | |||
| Ordinary annual services (Appropriation Act No. 1, 3 and 5) | 28,934 | 26,754 | 2,175 |
| Special appropriations | 59 | 49 | 10 |
| Expenses not requiring appropriation in the Budget year 2 | (701) | 821 | (1,522) |
| Departmental expenses | |||
| Departmental appropriation 1 | 167,866 | 166,518 | 1,348 |
| Expenses not requiring appropriation in the Budget year 2 | 12,599 | 17,743 | (5,144) |
| Total for Program 1.1 | 208,757 | 1211,885 | (3,128) |
| Outcome 1 Totals by appropriation type | |||
| Administered expenses | |||
| Ordinary annual services (Appropriation Act No. 1) | 28,934 | 26,754 | 2,175 |
| Special appropriations | 59 | 49 | 10 |
| Expenses not requiring appropriation in the Budget year 2 | (701) | 821 | (1,522) |
| Departmental expenses | |||
| Departmental appropriation 1 | 167,866 | 166,518 | 1,348 |
| Expenses not requiring appropriation in the Budget year 2 | 12,599 | 17,743 | (5,144) |
| Total expenses for Outcome 1 | 208,757 | 211,885 | (3,128) |
| Average staffing level (number) | 577 | 575 | 2 |
* Full year budget, including any subsequent adjustment made.
1 Departmental Appropriation combines ordinary annual services (Appropriation Act Nos. 1 and 3) and Retained Revenue Receipts under section 74 of the PGPA Act 2013.
2 Expenses not requiring appropriation in the Budget year is made up of depreciation and amortisation expenses, impairment of receivables, make good expense, audit fees and services provided free of charge.
| Outcome 2: Improve results for Indigenous Australians including in relation to school attendance, employment and community safety, through delivering services and programs, and through measures that recognise the special place that Indigenous people hold in this Nation. | Budget* 2017-18 $'000 (A) |
Actual Expenses 2017-18 $'000 (B) |
Variation 2017-18 $'000 (A)-(B) |
|---|---|---|---|
| Program 2.1: Jobs, Land and Economy | |||
| Administered expenses | |||
| Ordinary annual services (Appropriation Act No. 1) 3 | 646,286 | 634,498 | 11,788 |
| Special appropriations | 196,818 | 338,702 | (141,884) |
| Special accounts | 250,763 | 232,379 | 18,384 |
| Payments to corporate entities | 19,061 | 19,061 | - |
| Less expenses made from appropriations credited to special accounts | (195,820) | (342,702) | 146,882 |
| Expenses not requiring appropriation in the Budget year 2 | - | 1,080 | (1,080) |
| Total for Program 2.1 | 917,108 | 883,018 | 34,090 |
| Program 2.2: Children and Schooling | |||
| Administered expenses | |||
| Ordinary annual services (Appropriation Act No. 1) 3 |
248,014 | 256,582 | (8,568) |
| Other Services (Appropriation Act No.2) |
7,762 | 7,762 | - |
| Special appropriations | 70,588 | 66,972 | 3,616 |
| Expenses not requiring appropriation in the Budget year 2 | - | 489 | (489) |
| Total for Program 2.2 | 326,364 | 331,805 | (5,441) |
| Program 2.3: Safety and Wellbeing | |||
| Administered expenses | |||
| Ordinary annual services (Appropriation Act No. 1) 3 | 264,620 | 271,920 | (7,300) |
| Payments to corporate entities | 36,563 | 36,563 | - |
| Expenses not requiring appropriation in the Budget year 2 | - | 704 | (704) |
| Total for Program 2.3 | 301,183 | 309,187 | (8,004) |
| Program 2.4: Culture and Capability | |||
| Administered expenses | |||
| Ordinary annual services (Appropriation Act No. 1) 3 | 47,442 | 49,938 | (2,496) |
| Payments to corporate entities | 3,175 | 3,249 | (74) |
| Expenses not requiring appropriation in the Budget year | - | 94 | (94) |
| Total for Program 2.4 | 50,617 | 53,281 | (2,664) |
| Program 2.5: Remote Australia Strategies | |||
| Administered expenses | |||
| Ordinary annual services (Appropriation Act No. 1) 3 | 53,305 | 46,708 | 6,597 |
| Special accounts | 1,373 | 11,916 | (10,543) |
| Payments to corporate entities | 36,056 | 36,056 | - |
| Less expenses made from appropriations credited to special accounts | - | (5,250) | 5,250 |
| Expenses not requiring appropriation in the Budget year 2 | - | 305 | (305) |
| Total for Program 2.5 | 90,734 | 89,735 | 999 |
| Program 2.6: Evaluation and Research | |||
| Administered expenses | |||
| Ordinary annual services (Appropriation Act No. 1) 3 | 13,000 | 12,995 | 5 |
| Expenses not requiring appropriation in the Budget year 2 | - | - | - |
| Total for Program 2.6 | 13,000 | 12,995 | 5 |
| Program 2.7: Programme Support | |||
| Departmental expenses | |||
| Departmental appropriation 1 | 264,923 | 265,408 | (485) |
| Expenses not requiring appropriation in the Budget year 2 | 6,651 | 23,700 | (17,049) |
| Total for Program 2.7 | 271,574 | 289,108 | (17,534) |
| Outcome 2 Totals by appropriation type | |||
| Administered expenses | |||
| Ordinary annual services (Appropriation Act No. 1) | 1,272,667 | 1,272,641 | 26 |
| Other services (Appropriation Act No.2) | 7,762 | 7,762 | - |
| Special appropriations | 267,406 | 405,674 | (138,268) |
| Special accounts | 252,136 | 244,295 | 7,481 |
| Payments to corporate entities | 94,855 | 94,929 | (74) |
| Expenses not requiring appropriation in the Budget year 2 | - | 2,672 | (2,672) |
| Less expenses made from appropriations credited to special accounts | (195,820) | (347,952) | 152,132 |
| Departmental expenses | |||
| Departmental appropriation 1 | 264,923 | 265,408 | (485) |
| Expenses not requiring appropriation in the Budget year 2 | 6,651 | 23,700 | (17,049) |
| Total expenses for Outcome 2 | 1,970,580 | 1,969,129 | 1,451 |
| Average staffing level (number) | 1,456 | 1,432 | 78 |
* Full year budget, including any subsequent adjustment made.
1 Departmental appropriation combines ordinary annual services (Appropriation Act Nos. 1 and 3) and Retained Revenue Receipts under section 74 of the PGPA Act 2013.
2 Expenses not requiring appropriation in the Budget year is made up of depreciation and amortisation expenses, impairment of receivables, valuation of employee provisions, make good expense, audit fees and other non-cash expense items.
3 The variance in Administered Outcome 2 programs in ordinary annual services relates to the transfer of funding between programs. These transfers were approved by the Minister for Indigenous Affairs and the Minister for Finance (where required).
Procurement
PM&C undertook procurement and purchasing activities in 2017–18 in accordance with the principles set out in the Commonwealth Procurement Rules (CPRs) 2017 and CPRs 2018.
The CPRs are applied to PM&C’s procurement activities through the Secretary’s Instructions and Financial Rules and are supported by the provision of centralised advice on all procurement matters. This ensures that PM&C undertakes competitive, non-discriminatory procurement processes; uses resources efficiently, effectively, economically and ethically; and makes decisions in an accountable manner.
In 2017–18 PM&C exceeded its targets under both the Indigenous Procurement Policy and our refreshed Reconciliation Action Plan 2015–2018 by awarding over 60 new contracts to Indigenous businesses. This represents more than 6 per cent of the 985 PM&C contracts with a value over $10,000 awarded in 2017–18. The total estimated contract value of contracts that PM&C awarded to Indigenous businesses in 2017–18 was $16 million or around an estimated 8 per cent of contract value.
PM&C released its Indigenous Procurement Strategy in 2017–18, and the Department’s procurement activity in support of small to medium Indigenous businesses was recognised in May 2018, when PM&C was awarded the Supply Nation Supplier Diversity Government Member of the Year Award.
PM&C’s standard contract templates include provisions allowing the Auditor-General to have access to the relevant contractor’s premises. All contracts of $100,000 or greater (inclusive of GST) that were let during 2017–18 provided for the Auditor-General to have access to the relevant contractor’s premises where appropriate.
There were no contracts in 2017–18 in excess of $10,000 (inclusive of GST) that were exempt from being reported on AusTender on the basis that they would disclose exempt matters under the Freedom of Information Act 1982.
Information on expected procurements to be undertaken in 2018–19 through an open approach to market is published in PM&C’s annual procurement plan, available on the AusTender website.
Consultants
PM&C engages consultants for specialist expertise or when independent research, review or assessment is required. Decisions to engage consultants during 2017–18 were made in accordance with the Public Governance, Performance and Accountability Act 2013 (PGPA Act) and related regulations, including the CPRs and relevant internal policies.
During 2017–18, PM&C entered into 101 new consultancy contracts, with a total actual expenditure of $4.30 million. In addition, 24 ongoing consultancy contracts were active during the 2017–18 financial year, incurring a total actual expenditure of $2.74 million. Details of trends in consultancies are shown in Table 3.8. This annual report contains information about actual expenditure on contracts for consultancies of all values. Information on the value and categories of contracts and consultancies with a value of $10,000 or greater is available on the AusTender website.
| Consultancies | 2017–18 | 2016–17 | 2015–16 |
|---|---|---|---|
| Number of existing consultancies | 24 | 13 | 25 |
| Number of new consultancies | 101 | 91 | 86 |
| Total consultancies | 125 | 104 | 111 |
| Total expenditure | $7.05m | $3.29m | $2.94m |
Small and medium enterprises
PM&C recognises the importance of paying small businesses on time. The results of the Survey of Australian Government Payments to Small Business are available on the Department of the Treasury’s website.
PM&C supports small business participation in the government procurement market. Small and medium enterprises (SMEs) and small enterprise participation statistics are available on the Department of Finance website. PM&C’s procurement practices support SMEs by adopting whole-of-government solutions to simplify interactions with SMEs. This includes using the Commonwealth Contracting Suite for low-risk procurements valued under $200,000.
Advertising and market research
Under section 311A of the Commonwealth Electoral Act 1918, PM&C is required to disclose payments of $13,000 or more (inclusive of GST) for advertising and market research.
During 2017–18, PM&C conducted one advertising campaigns:
- ASEAN–Australia Special Summit 2008.
Further information on these advertising campaigns is available on the PM&C website and in the reports on Australian Government advertising prepared by the Department of Finance and located on their website.
| Firm | Service provided | 2017–18 Payments made in $ (incl GST) |
|---|---|---|
| JWS Research | Delivery of a survey to understand citizen’s experiences of, engagement with and trust in the public services provided by the Commonwealth Government. | 149,050 |
| ARC Public | Conduct market research for an effective communication strategy for building trust in the Government’s Data and Digital Agendas. | 129,806 |
| Dentsu Mitchell | State funeral newspaper notices. | 26,547 |
| Dentsu Mitchell Media Australia | Media communication of the APS Review calling for submissions; advertising inviting the public to make submissions on the current review that the Independent National Security Legislation Monitor is undertaking; advertising campaign for ASEAN–Australia Special Summit 2018; and recruitment advertising. | 146,956 |
| Mitchell Communication | Recruitment advertising and state funeral notices. | 79,321 |
| ESSENTIAL Media Communication | Market research activities to assist with testing the impact of a generic electricity bill with alternative hypothetical behaviourally informed electricity bills via 15-minute online experimental survey. | 64,350 |
| Access HQ | Market research to test the impact of different versions of electricity bills. | 23,782 |
| Australian Public Service Commission | Recruitment services. | 34,431 |
Asset management
PM&C manages its assets in accordance with the Secretary’s Instructions, relevant accounting standards and Department of Finance requirements.
PM&C administers significant strategic assets, in the form of investments, on behalf of the Australian Government for two special accounts: the Aboriginals Benefit Account (ABA) and the Aboriginal and Torres Strait Islander Land Account (ATSILA). Both the ABA and ATSILA investment strategies are focused on cash flow requirements, preservation of the fund and management of risks. Moneys that are surplus to immediate requirements are invested under section 58 of the PGPA Act. For further detail, refer to the ABA and ATSILA annual reports in the Appendices.
Non-compliance with finance law
No significant instances of non-compliance requiring a report to the responsible Minister in accordance with the PGPA Act have been recorded in the Department for 2017–18.
Grant programs
Information on grants that PM&C has awarded during the period 1 July 2017 to 30 June 2018 is available on the PM&C website.