Overall government results
At 30 June 2020, there were 343 Australian Government boards with 2,489 filled positions. Women filled 48.5 per cent of all board positions (1,206 positions were filled by women).
This result is an increase of 0.6 percentage points since 30 June 2019 when women filled 47.9 per cent of Government board positions (1,109 of 2,313 filled positions).
Table 1 details the number of boards, number and percentage of occupied positions by gender, and the percentage point difference from the previous year, since 2015.
Table 1: Gender balance on Australian Government boards as at 30 June, from 2015 to 2020
| Year | Number of boards |
Number of filled positions |
Number of women |
Number of men |
Percentage of positions filled by women |
Percentage point change since previous year |
|---|---|---|---|---|---|---|
| 2020 | 343 | 2,489 | 1,206 | 1,283 | 48.5 | +0.6 |
| 2019 | 341 | 2,313 | 1,109 | 1,204 | 47.9 | +2.1 |
| 2018 | 339 | 2,530 | 1,158 | 1,372 | 45.8 | +3.1 |
| 2017 | 337 | 2,508 | 1,072 | 1,436 | 42.7 | +2.2 |
| 2016 | 332 | 2,351 | 953 | 1,395 | 40.5 | +1.4 |
| 2015 | 361 | 2,570 | 1,005 | 1,565 | 39.1 | -0.6 |
Portfolio results
At 30 June 2020, four out of 13 portfolios met or exceeded the 50 per cent gender diversity target: Social Services (including Services Australia); Foreign Affairs and Trade; Health; and Industry, Science, Energy and Resources.
Women held between 45 and 50 per cent of board positions in a further six portfolios: Defence (including the Department of Veteran’s Affairs at 54.9 per cent women and the Department of Defence at 45.9 per cent women); Agriculture, Water and the Environment; Prime Minister and Cabinet; Education, Skills and Employment; Home Affairs and Attorney-General’s (see Figure 1 and Table 2).
Figure 1: Gender balance of overall Australian Government board positions as at 30 June 2020, by portfolio
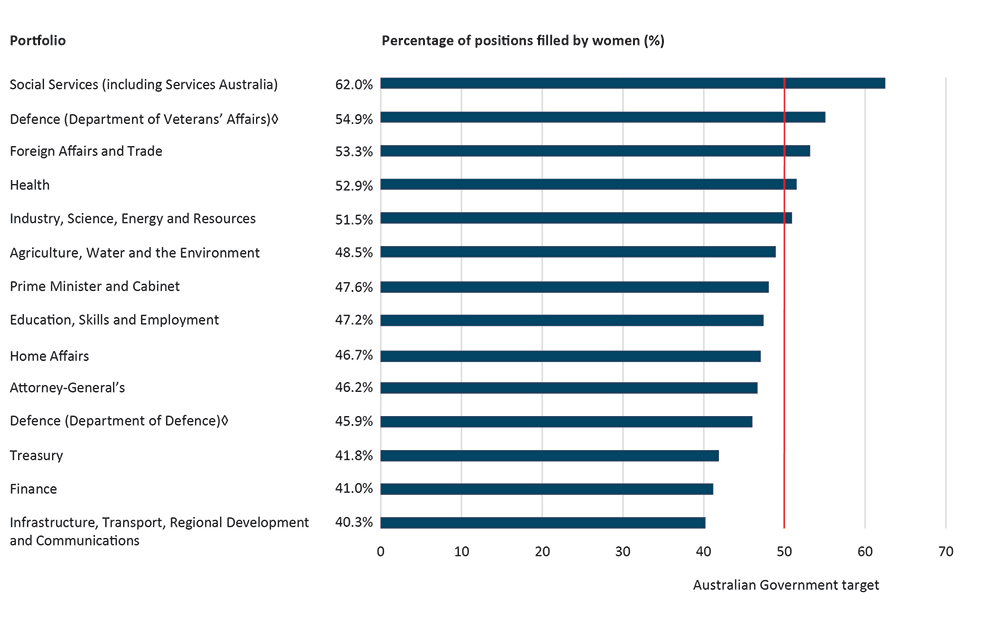
♦ Split shown given the two department structure within the Defence portfolio. Women held 48.8 per cent of positions in the Defence portfolio on 30 June 2020.
Table 2: Gender balance of overall Australian Government board positions as at 30 June 2020, by portfolio
| Portfolio | Number of boards |
Number of filled positions |
Number of women |
Percentage of positions filled by women at 30 June 2020 |
Percentage of positions filled by women at 30 June 2019 |
Percentage point difference from 30 June 2019 to 30 June 2020 |
|---|---|---|---|---|---|---|
| Agriculture, Water and the Environment | 35 | 237 | 115 | 48.5 | 46.3* | +2.2 |
| Attorney-General’s | 13 | 91 | 42 | 46.2 | 49.4 | -3.2 |
| Defence♦ (Department of Defence) | 16 | 111 | 51 | 45.9 | 44.9 | +1.0 |
| Defence♦ (Veterans’ Affairs) | 8 | 51 | 28 | 54.9 | 63.6 | -8.7 |
| Education, Skills and Employment | 15 | 89 | 42 | 47.2 | 47.7* | -0.5 |
| Finance | 6 | 39 | 16 | 41.0 | 40.0 | +1.0 |
| Foreign Affairs and Trade | 24 | 182 | 97 | 53.3 | 48.9 | +4.4 |
| Health | 53 | 682 | 361 | 52.9 | 52.6 | +0.3 |
| Home Affairs | 8 | 60 | 28 | 46.7 | 41.2 | +5.5 |
| Industry, Science, Energy and Resources | 28 | 200 | 103 | 51.5 | 50.7* | +0.8 |
| Infrastructure, Transport, Regional Development and Communications | 93 | 432 | 174 | 40.3 | 40.7* | -0.4 |
| Prime Minister and Cabinet | 14 | 124 | 59 | 47.6 | 50.9 | -3.3 |
| Social Services (including Services Australia) | 7 | 50 | 31 | 62.0 | 55.8 | +6.2 |
| Treasury | 23 | 141 | 59 | 41.8 | 43.3 | -1.5 |
| Total | 343 | 2489 | 1206 | 48.5 | 47.9 | 0.6 |
♦ Split shown given the two department structure within the Defence portfolio. Women held 48.8 per cent of positions in the Defence portfolio on 30 June 2020 (79 of 162 positions).
* 30 June 2019 figures have been calculated based on the portfolio’s current board composition.
New appointments
New appointments are those appointments made over the 2019-20 financial year that were not reappointments of the same person to the same position.
Of the 622 new appointments made in 2019-20, 50.5 per cent of appointees were women. This is a decrease since the last annual report when women comprised 52.7 per cent of new appointees.
Table 3 shows at 30 June 2020, in eight of 13 portfolios, women represented 50 per cent or more of new appointments.
Table 3: Gender balance of new appointments in 2019-20, by portfolio
| Portfolio | Number of new appointments | Number of women appointed | Percentage of new appointees who were women |
|---|---|---|---|
| Agriculture, Water and the Environment* | 71 | 39 | 54.9 |
| Attorney-General’s | 13 | 4 | 30.8 |
| Defence♦ (Department of Defence) | 46 | 26 | 56.5 |
| Defence♦ (including Veterans’ Affairs) | 5 | 2 | 40.0 |
| Education, Skills and Employment* | 28 | 16 | 57.1 |
| Finance | 4 | 1 | 25.0 |
| Foreign Affairs and Trade | 80 | 39 | 48.8 |
| Health | 140 | 74 | 52.9 |
| Home Affairs | 28 | 14 | 50.0 |
| Industry, Science, Energy and Resources* | 33 | 18 | 54.5 |
| Infrastructure, Transport, Regional Development and Communications* | 60 | 31 | 51.7 |
| Prime Minister and Cabinet | 93 | 42 | 45.2 |
| Social Services (including Services Australia) | 2 | 2 | 100 |
| Treasury | 19 | 6 | 31.6 |
| Total | 622 | 314 | 50.5 |
♦ Split shown given the two-department structure within the Defence portfolio. Women made up 54.9 per cent of new appointments to the Defence portfolio on 30 June 2020 (28 of 51 appointments).
* Appointments from before 1 February 2020 have been attributed based on the portfolio’s current board composition.
Chair and Deputy Chair roles
As the most senior board members, the Chair and Deputy Chair positions are crucial to the functioning of every board.
At 30 June 2020, women held 36.9 per cent of Chair and Deputy Chair positions across all Government boards. This result is 1.9 percentage points higher than the 30 June 2019 result, when women held 35.0 per cent of Chair and Deputy Chair positions.
Figure 2 details the portfolio results for the gender balance of Chair and Deputy Chair positions on 30 June 2020. This data excludes Chief Executive Officer, Executive Director and Managing Director positions.
Figure 2: Gender balance of Chair and Deputy Chair positions as at 30 June 2020, by portfolio

♦ Split shown given the two-department structure within the Defence portfolio. Women held 34.8 per cent of Chair and Deputy Chair positions in the Defence portfolio on 30 June 2020.
External nominations
An external nomination is one which is made by a person or organisation who is not the Minister responsible for approving the appointment, or a member of their department. This may include, for example, a state or territory government or non-government body, and extends to appointment processes where it is either legislated or accepted practice for nominations to be provided to the Minister.
While all nominations are reported, not all nominations made by external bodies resulted in the appointment of the nominee. For example, multiple nominations may be received for the same vacancy.
Of the 63 external nominations received for Government board appointments in 2019-20, 49.2 per cent of nominations were for women (see Table 5). This is an increase of 14.8 percentage points from the 2018-19 result, when women accounted for 34.4 per cent of external nominations.
Table 5: External nominations for board positions received in 2019-20, by nominating organisation
| Nominating organisation | Number of nominations given |
Number of women nominated |
Percentage of nominees who were women |
|---|---|---|---|
| New South Wales Government | 9 | 6 | 66.7 |
| Australian Council of Trade Unions | 5 | 3 | 60 |
| Northern Territory Government | 4 | 1 | 25 |
| Queensland Government | 4 | 2 | 50 |
| South Australian Government | 4 | 2 | 50 |
| Council of Australian Governments Energy Council | 3 | 2 | 66.7 |
| Nominated by agreement between the States, the Australian Capital Territory and the Northern Territory | 3 | 1 | 33.3 |
| Members of the Ex-Services Organisations Round Table | 2 | 0 | 0 |
| New Zealand Government | 2 | 2 | 100 |
| Nomination panel for ABC and SBS Board Appointments | 2 | 0 | 0 |
| Territory Natural Resources Management | 2 | 2 | 100 |
| Victorian Government | 2 | 1 | 50 |
| Western Australian Government | 2 | 1 | 50 |
| The Anglican Church of Australia | 1 | 0 | 0 |
| The Associated Protestant Churches Chaplaincy Board | 1 | 0 | 0 |
| Australian Capital Territory Government | 1 | 1 | 100 |
| Australian Chamber of Commerce and Industry | 1 | 1 | 100 |
| Australian Strategic Policy Institute Council | 1 | 0 | 0 |
| Business Council of Australia | 1 | 0 | 0 |
| Chamber of Minerals and Energy of Western Australia | 1 | 0 | 0 |
| The Department of the Senate | 1 | 0 | 0 |
| The House of Representatives | 1 | 0 | 0 |
| Independent Schools Australia | 1 | 1 | 100 |
| Leader of the Opposition | 1 | 0 | 0 |
| Master Builders Australia | 1 | 1 | 100 |
| Minerals Council of Australia | 1 | 1 | 100 |
| Minister for Industrial Relations | 1 | 1 | 100 |
| National Sikh Council of Australia | 1 | 0 | 0 |
| Pacific Community | 1 | 1 | 100 |
| Pacific Islands Forum Secretariat | 1 | 0 | 0 |
| Prime Minister of Australia | 1 | 0 | 0 |
| The Uniting Church in Australia | 1 | 1 | 100 |
| 63 | 31 | 49.2 |