At 30 June 2022, women held 41 per cent of Chair and Deputy Chair positions across all Government Boards.
This result is 1.9 percentage points higher than the 30 June 2021 result, when women held 39.1 per cent of Chair and Deputy Chair positions.
Figure 2 details the portfolios results for the gender balance of Chair and Deputy Chair positions on 30 June 2022.
Figure 2: Gender balance of Chair and Deputy Chair positions as at 30 June 2022, by portfolio
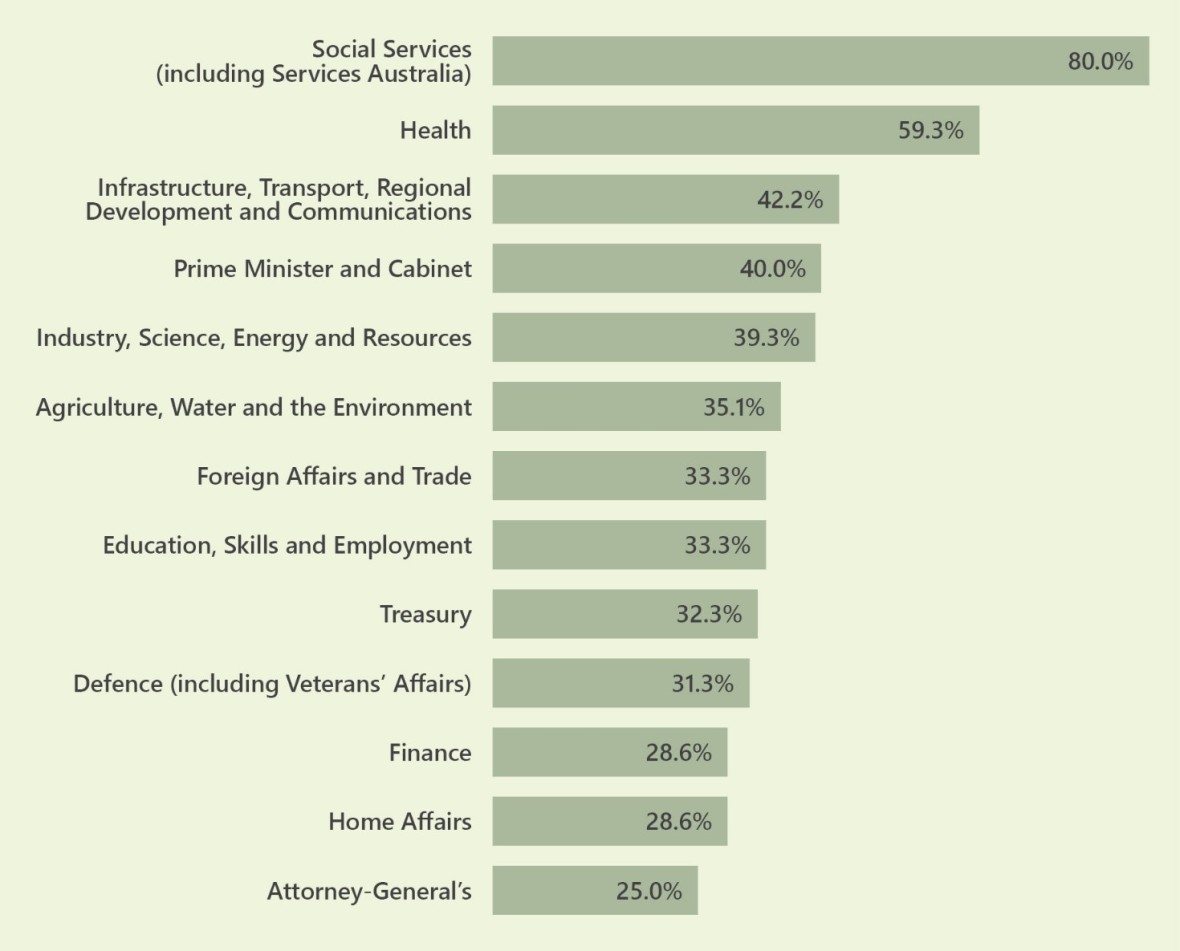
Table 4: Gender balance of Chair and Deputy Chair positions as at 30 June 2022, by portfolio
| Portfolio | Number of boards | Number of filled Chair and Deputy Chair positions | Number of Chair and Deputy Chair positions filled by women | Percentage of Chair and Deputy Chair positions filled by women, as at 30 June 2022 |
Percentage point difference from 30 June 2021 to 30 June 2022 |
|---|---|---|---|---|---|
| Agriculture, Water and the Environment | 34 | 37 | 13 | 35.1 | 5.4 |
| Attorney-General's | 8 | 8 | 2 | 25.0 | 8.3 |
| Defence (including Veterans' Affairs) | 14 | 16 | 5 | 31.3 | -8.8 |
| Education, Skills and Employment | 20 | 21 | 7 | 33.3 | -13.8 |
| Finance | 6 | 7 | 2 | 28.6 | -21.4 |
| Foreign Affairs and Trade | 24 | 24 | 8 | 33.3 | -9.6 |
| Health | 48 | 54 | 32 | 59.3 | 12.6 |
| Home Affairs | 7 | 7 | 2 | 28.6 | 6.4 |
| Industry, Science, Energy and Resources | 27 | 28 | 11 | 39.3 | 1.4 |
| Infrastructure, Transport, Regional Development and Communications | 94 | 147 | 62 | 42.2 | 3.4 |
| Prime Minister and Cabinet | 15 | 20 | 8 | 40.0 | -1.2 |
| Social Services (including Services Australia) | 5 | 5 | 4 | 80.0 | -20.0 |
| Treasury | 21 | 31 | 10 | 32.3 | 5.6 |
| TOTAL | 323 | 405 | 166 | 41.0 | 1.8 |