Overall results for reportable positions
As at 30 June 2023, there were 344 Australian Government boards and bodies with 2,208 filled reportable positions. Women filled 1,139 of these positions, or 51.6 per cent.
This result is an increase of 0.2 percentage points since 30 June 2022, when women filled 51.4 per cent of reportable positions on Australian Government boards (1,138 of 2,214 reportable filled positions).
The 2022-2023 financial year was the first reporting period to indicate that gender diverse and/or gender non-conforming people held a small number of positions on Australian Government boards. Whilst data on this group of board members has been included in this report, these responses have not been specifically identified for privacy reasons.
Table 1 details the number of boards, number of filled reportable positions, the number, and the percentage of, reportable positions filled by women and the percentage point difference in women’s representation from the previous year, since 2017.
| Year | Number of boards | Number of filled reportable positions | Number of reportable positions filled by women | Percentage of reportable positions filled by women | Percentage point change since previous year |
|---|---|---|---|---|---|
| 2023 | 344 | 2,208 | 1,139 | 51.6 | +0.2 |
| 2022 | 335 | 2,214 | 1,138 | 51.4 | +1.8 |
| 2021 | 342 | 2,315 | 1,149 | 49.6 | +1.1 |
| 2020 | 343 | 2,489 | 1,206 | 48.5 | +0.6 |
| 2019 | 341 | 2,313 | 1,109 | 47.9 | +2.1 |
| 2018 | 339 | 2,530 | 1,158 | 45.8 | +3.1 |
| 2017 | 337 | 2,508 | 1,072 | 42.7 | +2.2 |
Portfolio results
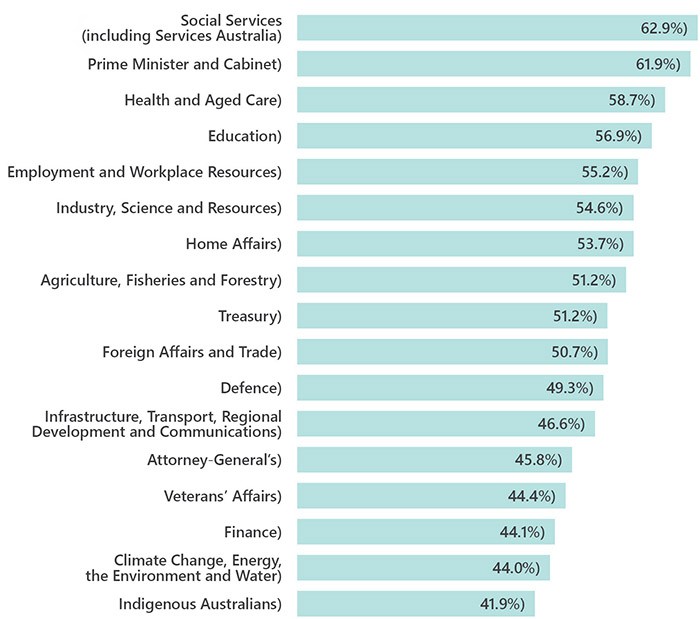
As at 30 June 2023, ten out of 17 portfolios met or exceeded 50 per cent representation of women on Australian Government boards:
- Social Services (including Services Australia)
- Prime Minister and Cabinet
- Health and Aged Care
- Education
- Employment and Workplace Relations
- Industry, Science and Resources
- Home Affairs
- Agriculture, Fisheries and Forestry
- Treasury
- Foreign Affairs and Trade
| Portfolio | Number of boards as at 30 June 2023 | Number of filled positions as at 30 June 2023 | Number of positions filled by women as at 30 June 2023 | Percentage of positions filled by women as at 30 June 2023 | Percentage of positions filled by women as at 30 June 2022 | Percentage point difference since 30 June 2022 |
|---|---|---|---|---|---|---|
| Social Services (including Services Australia) | 5 | 35 | 22 | 62.9 | 70.0 | -7.1 |
| Prime Minister and Cabinet | 4 | 21 | 13 | 61.9 | 51.6 | +10.3 |
| Health and Aged Care | 47 | 479 | 281 | 58.7 | 59.3 | -0.6 |
| Education | 26 | 188 | 107 | 56.9 | 52.7 | +4.2 |
| Employment and Workplace Relations | 8 | 67 | 37 | 55.2 | 52.7 | +2.5 |
| Industry, Science and Resource | 21 | 119 | 65 | 54.6 | 46.7 | +7.9 |
| Home Affairs | 4 | 41 | 22 | 53.7 | 48.9 | +4.8 |
| Treasury | 24 | 127 | 65 | 51.2 | 46.3 | +4.9 |
| Agriculture, Fisheries and Forestry | 19 | 121 | 62 | 51.2 | 46.3 | +4.9 |
| Foreign Affairs and Trade | 21 | 134 | 68 | 50.7 | 52.6 | -1.9 |
| Defence | 12 | 67 | 33 | 49.3 | 48.2 | +1.1 |
| Infrastructure, Transport, Regional Development, Communications and the Arts | 96 | 373 | 174 | 46.6 | 46.0 | +0.6 |
| Attorney-General’s | 10 | 48 | 22 | 45.8 | 57.0 | -11.2 |
| Veterans’ Affairs | 6 | 36 | 16 | 44.4 | 48.2 | -3.8 |
| Finance | 6 | 34 | 15 | 44.1 | 47.5 | -3.4 |
| Climate Change, Energy, the Environment and Water | 25 | 182 | 80 | 44.0 | 46.7 | -2.7 |
| Indigenous Australians | 10 | 136 | 57 | 41.9 | 51.6 | -9.7 |
| Total | 344 | 2,208 | 1,139 | 51.6 | 51.4 | +0.2 |
New appointments
New appointments are appointments made within the 2022-2023 financial year, (the period from 1 July 2022 to 30 June 2023) that were not a reappointment of the same person to the same position.
Of the 612 new appointments made in 2022-2023, 52.9 per cent (324 new appointments) were for women. This is a decrease of 1.5 percentage points since 2021-2022, when women comprised 54.4 per cent of new appointments.
Table 3 shows that in 2022-2023, in seven of 17 portfolios, women received less than 50 per cent of new appointments.
| Portfolio | Number of new appointments 2022-2023 | Number of women newly appointed 2022-2023 | Percentage of new appointments who were women 2022-2023 | Percentage of new appointments who were women 2021-2022 | Percentage point difference in new appointments between 2021-2022 and 2022-2023 |
|---|---|---|---|---|---|
| Prime Minister and Cabinet | 28 | 23 | 82.1 | 53.8 | +28.3 |
| Employment and Workplace Relations | 25 | 19 | 76.0 | 56.5 | +19.5 |
| Finance | 3 | 2 | 66.7 | 100.0 | -33.3 |
| Education | 114 | 69 | 60.5 | 56.5 | +4.0 |
| Foreign Affairs and Trade | 20 | 12 | 60.0 | 68.0 | -8.0 |
| Industry, Science and Resources | 22 | 13 | 59.1 | 30.6 | +28.5 |
| Defence | 7 | 4 | 57.1 | 39.1 | +18.0 |
| Treasury | 37 | 21 | 56.8 | 45.5 | +11.3 |
| Infrastructure, Transport, Regional Development, Communications and the Arts | 91 | 48 | 52.7 | 47.3 | +5.4 |
| Health and Aged Care | 55 | 29 | 52.7 | 65.1 | -12.4 |
| Agriculture, Fisheries and Forestry | 31 | 15 | 48.4 | 49.2 | -0.8 |
| Climate Change, Energy, the Environment and Water | 48 | 22 | 45.8 | 30.6 | +15.2 |
| Veterans’ Affairs | 11 | 5 | 45.5 | 39.1 | +6.4 |
| Home Affairs | 7 | 3 | 42.9 | 52.4 | -9.5 |
| Social Services (including Services Australia) | 10 | 4 | 40.0 | 66.7 | -26.7 |
| Indigenous Australians | 92 | 33 | 35.9 | 53.8 | -17.9 |
| Attorney-General’s | 11 | 2 | 18.2 | 69.2 | -51.0 |
| Total | 612 | 324 | 52.9 | 54.4 | -1.5 |