Target: Women to hold 50% of all Australian Government board positions
As at 30 June 2024, there were 347 Australian Government boards and bodies with 2,187 filled reportable positions. Women filled 1,190 of these positions, or 54.4%. This result is an increase of 2.8% since 30 June 2023, and is the highest representation of women in overall positions to date.
Table 1 details the number of boards, number of filled reportable positions, the number, and the percentage of reportable positions filled by women and the percentage point difference in women’s representation from the previous year, since 2016-17.
Table 1. Gender Balance on Australian Government Boards as at 30 June, from 2017 to 2024
| Year | Number of boards | Number of filled reportable positions | Number of reportable positions filled by women | Percentage of reportable positions filled by women | Percentage point change since previous year |
|---|---|---|---|---|---|
| 2023-24 | 347 | 2,187 | 1,190 | 54.4% | +2.8 |
| 2022-23 | 344 | 2,208 | 1,139 | 51.6% | +0.2 |
| 2021-22 | 335 | 2,214 | 1,138 | 51.4% | +1.8 |
| 2020-21 | 342 | 2,315 | 1,149 | 49.6% | +1.1 |
| 2019-20 | 343 | 2,489 | 1,206 | 48.5% | +0.6 |
| 2018-19 | 341 | 2,313 | 1,109 | 47.9% | +2.1 |
| 2017-18 | 339 | 2,530 | 1,158 | 45.8% | +3.1 |
| 2016-17 | 337 | 2,508 | 1,072 | 42.7% | +2.2 |
Target: Women hold at least 40% of Australian Government board positions at the individual board level
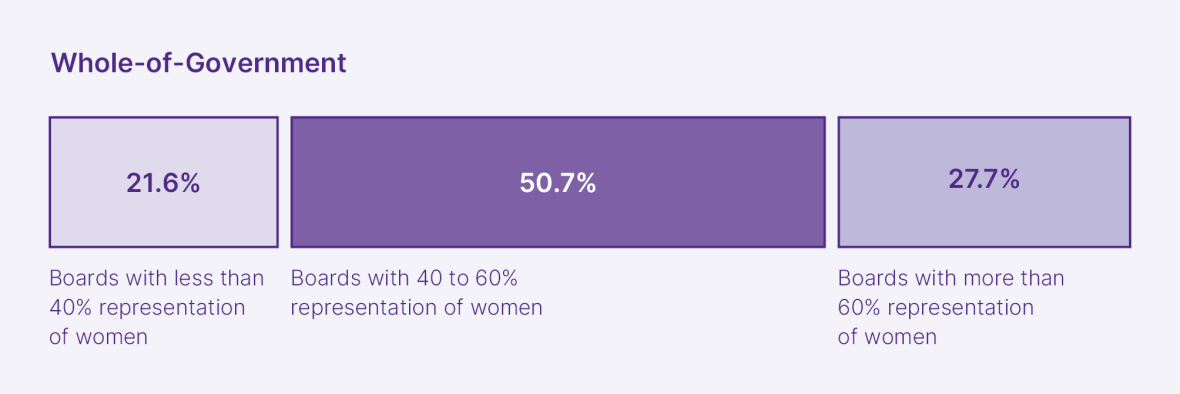
As at 30 June 2024, 347 individual boards were reported across the Australian Government. Of these boards, women hold at least 40% of positions on 272 boards (78.4%).
On 75 boards (21.6%) women hold less than 40% of positions. On 96 boards (27.7%) women hold over 60% of positions.
Figure 1. Representation of women on individual boards, as at 30 June 2024

New target - baseline: Women to hold 50% of Australian Government board positions at the portfolio level
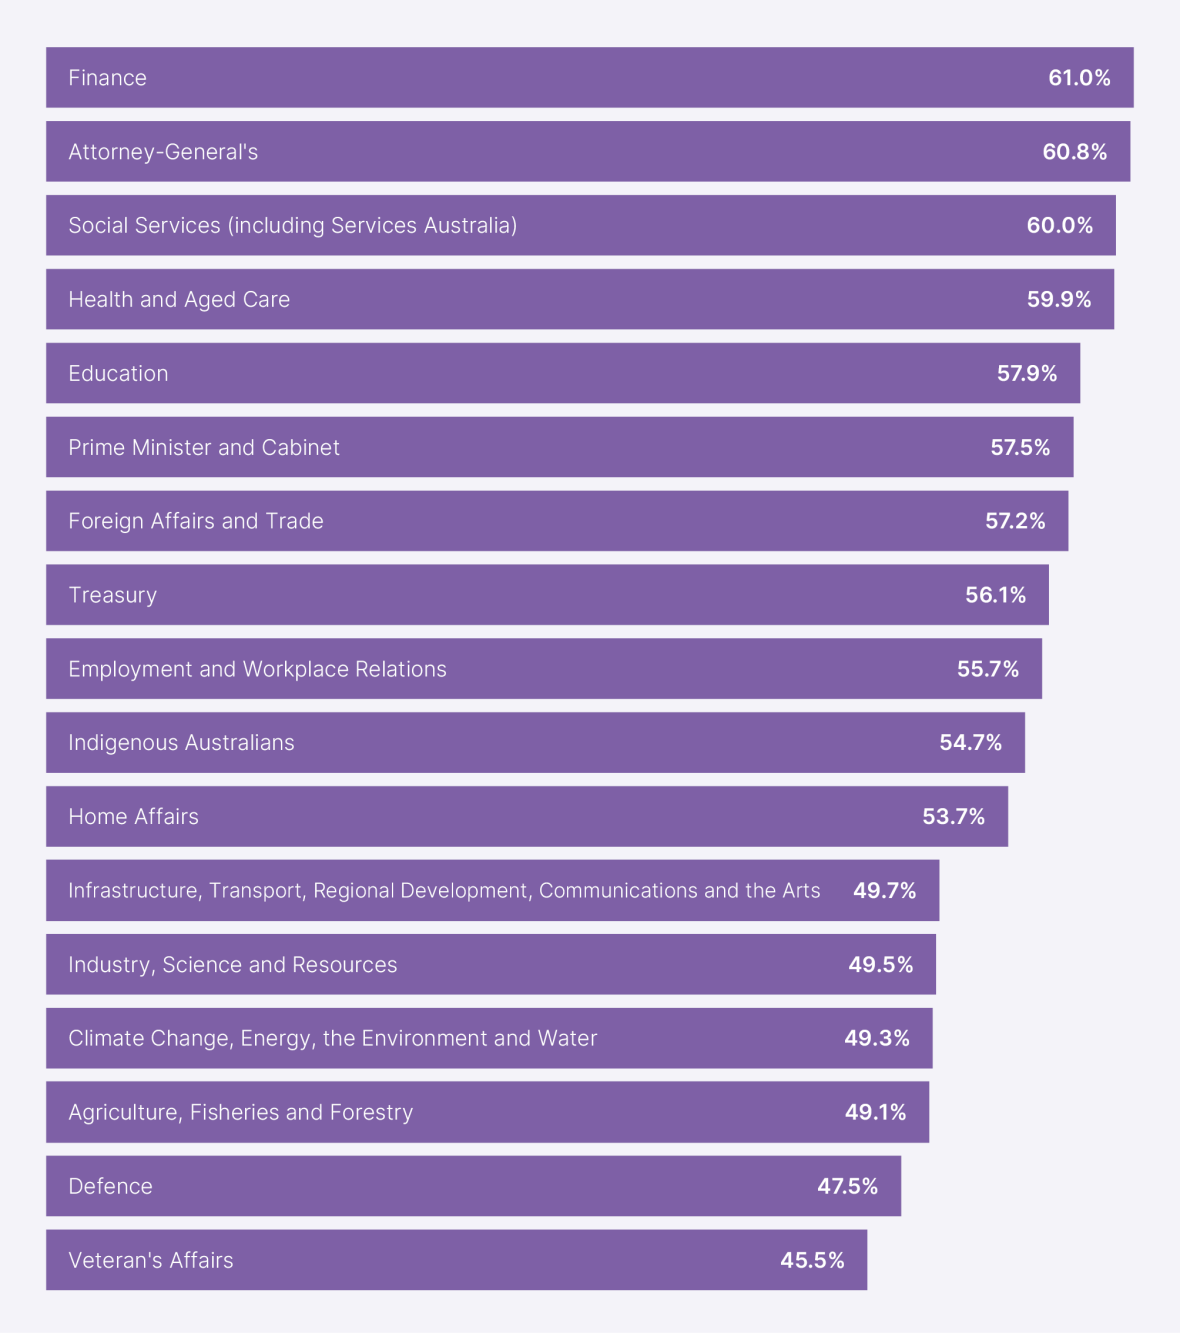
As at June 2024, 11 out of 17 portfolios met or exceeded 50% representation of women on Australian Government boards (an increase from ten portfolios in 2022-23). Figure 2 shows the results for individual portfolios with more detail provided in Table 2.
Figure 2. Percentage of reportable positions on Australian Government boards filled by women as at 30 June 2024, by portfolio

Text description of Figure 2
Finance 61.0%, Attorney-General's 60.8%, Social Services (including Services Australia) 60.0%, Health and Aged Care 59.9%, Education 57.9%, Prime Minister and Cabinet 57.5%, Foreign Affairs and Trade 57.2%, Treasury 56.1%, Employment and Workplace Relations 55.7%, Indigenous Australians 54.7%, Home Affairs 53.7%, Infrastructure, Transport, Regional Development, Communications and the Arts 49.7%, Industry, Science and Resources 49.5%, Climate Change, Energy, the Environment and Water 49.3%, Agriculture, Fisheries and Forestry 49.1%, Defence 47.5% and Veteran's Affairs 45.5%.
Table 2. Gender Balance of overall Australian Government board positions as at 30 June 2024, by portfolio
| Portfolio | Number of boards as at 30 June 2024 | Number of filled positions as at 30 June 2024 | Number of positions filled by women as at 30 June 2024 | Percentage of positions filled by women as at 30 June 2024 | Percentage of positions filled by women as at 30 June 2023 | Percentage point difference since 30 June 2023 |
|---|---|---|---|---|---|---|
| Finance | 7 | 41 | 25 | 61.0% | 44.1% | +16.9 |
| Attorney-General’s | 11 | 74 | 45 | 60.8% | 45.8% | +15.0 |
| Social Services (including Services Australia) | 6 | 45 | 27 | 60.0% | 62.9% | -2.9 |
| Health and Aged Care | 49 | 414 | 248 | 59.9% | 58.7% | +1.2 |
| Education | 23 | 178 | 103 | 57.9% | 56.9% | +1.0 |
| Prime Minister and Cabinet | 6 | 40 | 23 | 57.5% | 61.9% | -4.4 |
| Foreign Affairs and Trade | 19 | 138 | 79 | 57.2% | 50.7% | +6.5 |
| Treasury | 22 | 132 | 74 | 56.1% | 51.2% | +4.9 |
| Employment and Workplace Relations | 13 | 106 | 59 | 55.7% | 55.2% | +0.5 |
| Indigenous Australians | 9 | 64 | 35 | 54.7% | 41.9% | +12.8 |
| Home Affairs | 5 | 41 | 22 | 53.7% | 53.7% | 0.0 |
| Infrastructure, Transport, Regional Development, Communications and the Arts | 96 | 394 | 196 | 49.7% | 46.6% | +3.1 |
| Industry, Science and Resources | 19 | 95 | 47 | 49.5% | 54.6% | -5.1 |
| Climate Change, Energy, the Environment and Water | 27 | 221 | 109 | 49.3% | 44.0% | +5.3 |
| Agriculture, Fisheries and Forestry | 17 | 110 | 54 | 49.1% | 51.2% | -2.1 |
| Defence | 12 | 61 | 29 | 47.5% | 49.3% | -1.8 |
| Veterans’ Affairs | 6 | 33 | 15 | 45.5% | 44.4% | +1.1 |
| Total | 347 | 2,187 | 1,190 | 54.4% | 51.6% | +2.8 |
New target - baseline: Women to hold 50% of Chair and Deputy Chair positions on Australian Government boards at the portfolio level
As at 30 June 2024, women held 45.3% of Chair and Deputy Chair positions on Australian Government boards. This result is 3 percentage points higher than the 30 June 2023 result.
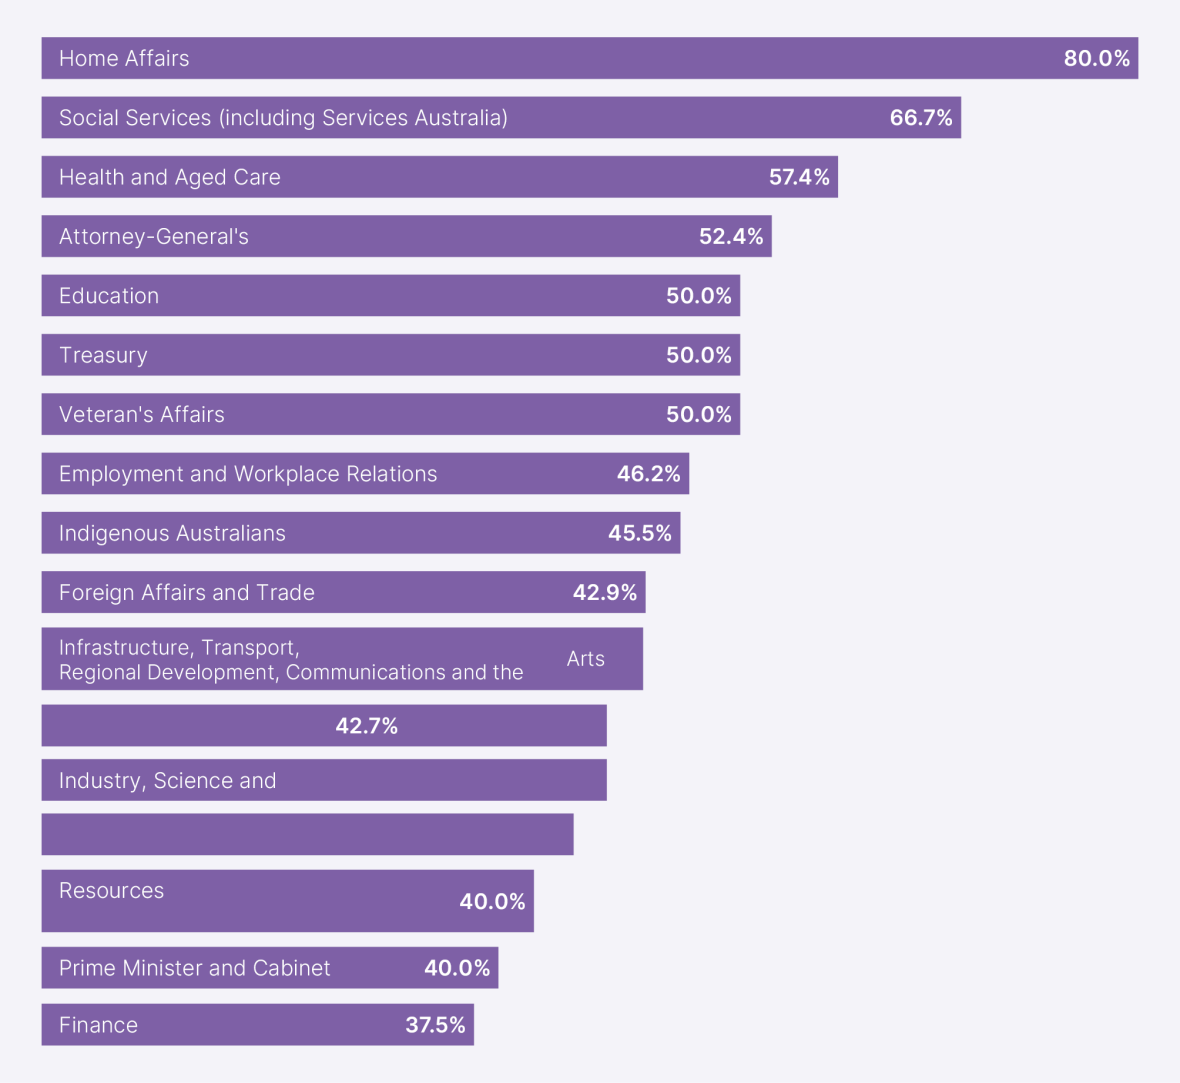
In seven of 17 portfolios, women held 50% or more of Chair and Deputy Chair positions. This result is an increase from the previous year where four of 17 portfolios had at least 50% representation of women in Chair and Deputy Chair positions. Figure 3 and Table 3 detail the portfolio results for the gender balance of Chair and Deputy Chair positions as at 30 June 2024.
Figure 3. Percentage of reportable Chair and Deputy Chair positions filled by women, as at 30 June 2024

Text description of Figure 3
Home Affairs 80.0%, Social Services (including Services Australia) 66.7%, Health and Aged Care 57.4%, Attorney-General's 52.4%, Education 50.0%, Treasury 50.0%, Veteran's Affairs 50.0%, Employment and Workplace Relations 46.2%, Indigenous Australians 45.5%, Foreign Affairs and Trade 42.9%, Infrastructure, Transport, Regional Development, Communications and the Arts 42.7%, Industry, Science and Resources 40.0%, Prime Minister and Cabinet 40.0%, Finance 37.5%, Climate Change, Energy, the Environment and Water 34.5%, Agriculture, Fisheries and Forestry 31.8% and Defence 30.0%.
Table 3. Gender balance of Chair and Deputy Chair positions as at 30 June 2024, by portfolio
| Portfolio | Number of Chair and Deputy Chair positions | Number of Chair and Deputy Chair positions filled by women | Percentage of Chair and Deputy Chair positions filled by women | Percentage of positions filled by women as at 30 June 2023 | Percentage point difference since 30 June 2023 |
|---|---|---|---|---|---|
| Home Affairs | 5 | 4 | 80.0% | 25.0% | +55.0 |
| Social Services (including Services Australia) | 6 | 4 | 66.7% | 80.0% | -13.3 |
| Health and Aged Care | 54 | 31 | 57.4% | 59.2% | -1.8 |
| Attorney-General's | 21 | 11 | 52.4% | 43.8% | +8.6 |
| Education | 18 | 9 | 50.0% | 41.7% | +8.3 |
| Treasury | 28 | 14 | 50.0% | 38.7% | +11.3 |
| Veterans' Affairs | 6 | 3 | 50.0% | 50.0% | 0.0 |
| Employment and Workplace Relations | 13 | 6 | 46.2% | 37.5% | +8.7 |
| Indigenous Australians | 11 | 5 | 45.5% | 45.5% | 0.0 |
| Foreign Affairs and Trade | 21 | 9 | 42.9% | 31.6% | +11.3 |
| Infrastructure, Transport, Regional Development, Communications and the Arts | 150 | 64 | 42.7% | 39.7% | +3.0 |
| Industry, Science and Resources | 15 | 6 | 40.0% | 57.9% | -17.9 |
| Prime Minister and Cabinet | 5 | 2 | 40.0% | 0.0% | +40.0 |
| Finance | 8 | 3 | 37.5% | 28.6% | +8.9 |
| Climate Change, Energy, the Environment and Water | 29 | 10 | 34.5% | 21.7% | +12.8 |
| Agriculture, Fisheries and Forestry | 22 | 7 | 31.8% | 45.8% | -14.0 |
| Defence | 10 | 3 | 30.0% | 38.5% | -8.5 |
| Total | 422 | 191 | 45.3% | 42.3% | +3.0 |
Additional data
New appointments
New appointments are appointments made within the 2023-2024 financial year, (the period from 1 July 2023 to 30 June 2024) that were not a reappointment of the same person to the same position.
Of the 908 new appointments made in 2023-2024, 56.9% (517 new appointments) were for women. This is an increase of 4.0 percentage points since 2022-2023, when women comprised 52.9% of new appointments.
Table 4 shows that in 2023-2024, for 11 of 17 portfolios, women received more than 50% of new appointments.
Table 4. Gender Balance of new appointments to Australian Government boards in 2023-2024, by portfolio
| Portfolio | Number of new appointments 2023-2024 | Number of women newly appointed 2023-2024 | Percentage of new appointments who were women 2023-2024 | Percentage of new appointments who were women 2022-2023 | Percentage point difference in new appointments between |
|---|---|---|---|---|---|
| Finance | 13 | 11 | 84.6% | 66.7% | +17.9 |
| Attorney-General's | 37 | 27 | 73.0% | 18.2% | +54.8 |
| Foreign Affairs and Trade | 49 | 32 | 65.3% | 60.0% | +5.3 |
| Prime Minister and Cabinet | 23 | 15 | 65.2% | 82.1% | -16.9 |
| Social Services (including Services Australia) | 16 | 10 | 62.5% | 40.0% | +22.5 |
| Climate Change, Energy, the Environment and Water | 73 | 44 | 60.3% | 45.8% | +14.5 |
| Education | 157 | 94 | 59.9% | 60.5% | -0.6 |
| Health and Aged Care | 135 | 80 | 59.3% | 52.7% | +6.6 |
| Infrastructure, Transport, Regional Development, Communications and the Arts | 146 | 78 | 53.4% | 52.7% | +0.7 |
| Employment and Workplace Relations | 47 | 25 | 53.2% | 76.0% | -22.8 |
| Treasury | 58 | 30 | 51.7% | 56.8% | -5.1 |
| Industry, Science and Resources | 78 | 38 | 48.7% | 59.1% | -10.4 |
| Agriculture, Fisheries and Forestry | 39 | 18 | 46.2% | 48.4% | -2.2 |
| Defence | 18 | 8 | 44.4% | 57.1% | -12.7 |
| Home Affairs | 14 | 6 | 42.9% | 42.9% | 0.0 |
| Veterans' Affairs | 5 | 1 | 20.0% | 45.5% | -25.5 |
| Indigenous Australians | 0 | 0 | N/A* | 35.9% | N/A* |
| Total | 908 | 517 | 56.9% | 52.9% | +4.0 |
* The Indigenous Australians portfolio did not have any new appointments in the period 2023-24.
External nominations
External nominations refer to nominations made by an individual, an organisation or a number of organisations who are not the Australian Government Minister responsible for approving the appointment, or a member of their department. This may include a state or territory government or a non-government organisation and extends to appointment processes where it is either legislated or accepted practice for nominations to be provided to the Minister. Not all nominations made by external bodies result in the appointment of that nominee, as multiple nominations may be received for the same vacancy.
In 2023-2024 (for the period from 1 July 2023 to 30 June 2024), women received 128 of 235 external nominations, equating to 54.5%. This result is 9.3 percentage points higher than in 2022-2023, when women received 45.2% of external nominations.
