Australia has a short history of nationally legislated paid parental leave compared to other high income countries, with the exception of the USA (Baird & Williamson, 2010). In 2010 Australia introduced the Paid Parental Leave Act 2010. This was a breakthrough policy that for the first time provided eligible working parents in Australia with a legislated right to a period of paid parental leave. The 2010 Act stipulated 18 weeks for the primary carer paid at the national minimum wage (NMW). While this was an important policy initiative, the scheme was shorter in length and less generous in income replacement level than many of the paid parental leave systems that have been operating in comparable economies for many years. In 2013 the scheme was expanded to include 2 weeks of reserved leave for fathers, called Dad and Partner Pay (DaPP) also paid at the national minimum wage.
Official evaluations of the paid parental leave scheme have shown it to be beneficial to working parents, especially mothers in low-wage work where the employer did not provide paid parental leave (Martin et al., 2014).
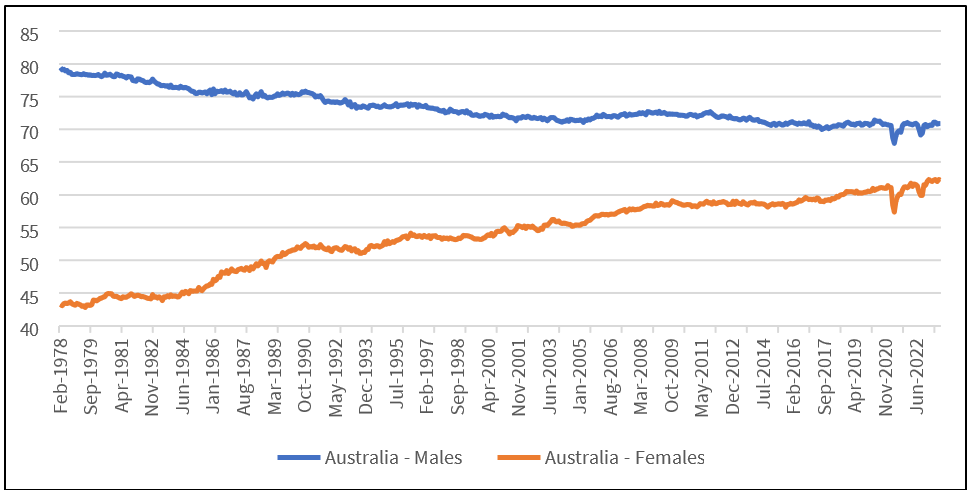
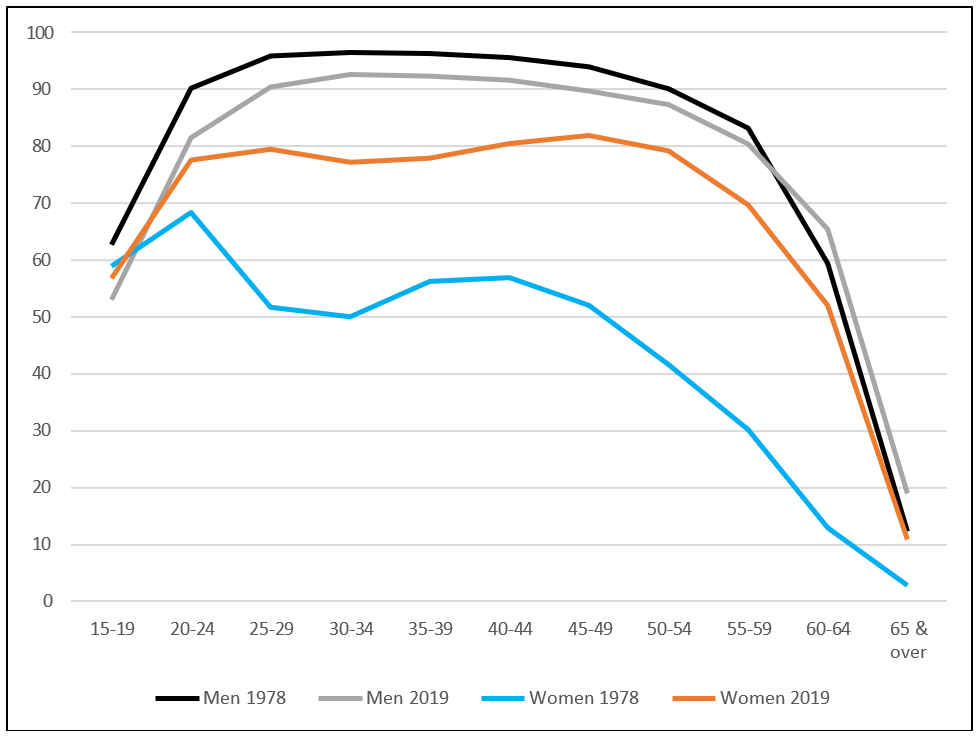
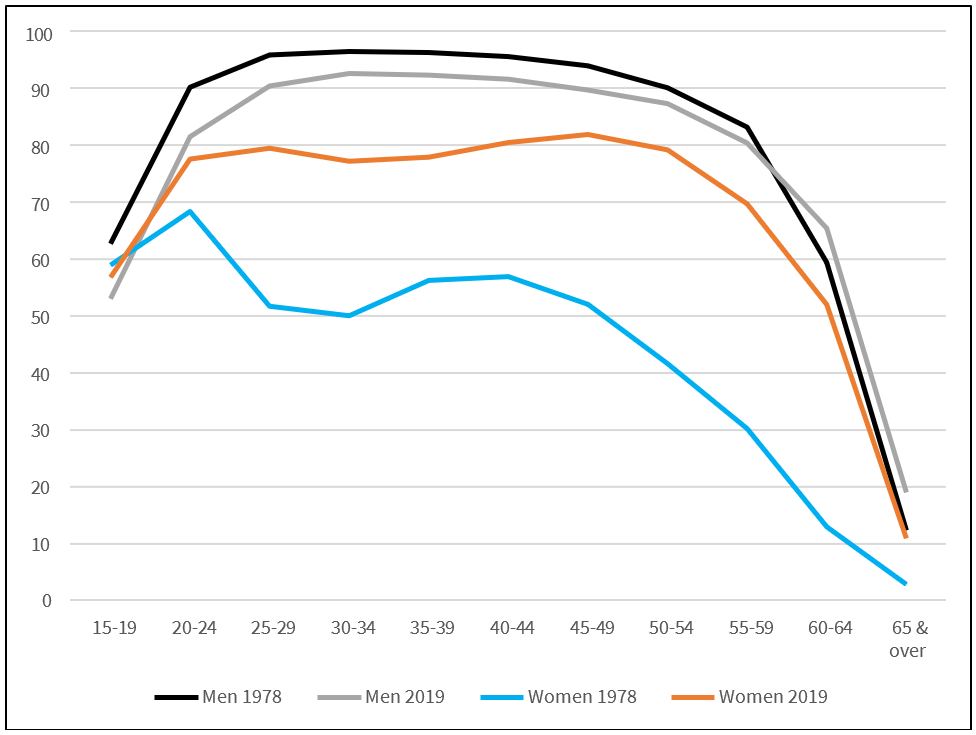
Australian women’s participation in paid work has risen rapidly over the past 40 years (see Figure 2), to reach an historically high participation rate of 62.4% in August 2022, with a particularly rapid transformation in the participation of women of childbearing ages (see Figure 3). Nevertheless, women have a lower participation rate than men, work less hours than men and have lower wages than men. These gendered workforce gaps are in large part shaped by women’s disproportionate responsibility for unpaid family and community care which many women manage by shifting to part-time employment after childbirth (Baird & Heron, 2020).
Paid parental leave policy is now an expected part of the Australian public policy framework (Baird & Williamson, 2010; Baird, Hamilton & Constantin, 2021) and potentially a key policy support for women’s economic opportunities and gender equality. Some large private sector employers now provide generous paid parental leave schemes (Baird et al., 2021, WGEA, 2022a). Increasing interest in this policy area has been growing rapidly, especially in encouraging and enabling fathers to share the care (see for example KPMG, 2021; Parents at Work, 2022; Wood et al., 2021).
Change in young workers’ aspirations around combining work andv care is leading to converging gender roles and expectations among young Australian parents, with men who are fathers looking for public policy to support their care aspirations (Hill, Baird et al., 2019, Churchill & Craig, 2022). The male breadwinner model has been hard to shift in Australia, with social and economic trends making the ‘One-Plus’ or one-and-a-half Breadwinner model the most common family type (Baird & Heron, 2020).
Figure 2. Australia – Labour force participation rates, by sex (Feb 1978 – Sep 2022)

Source: Australian Bureau of Statistics (2022, September). Labour Force, Australia. ABS

Figure 4. Proportion of actual hours worked (males and females), March 1991 and March 2015 to March 2022

Paid Parental Leave Act 2010 – Objectives
The objectives of the Paid Parental Leave Act (2010)[1] must be read within the particular Australian context. The Act was introduced following a comprehensive analysis of the need for a paid parental leave scheme by the Productivity Commission (2009).
The objective of Parental Leave Pay is to provide financial support to primary carers (1.1.P.230) (mainly birth mothers) of children, in order to:
- allow those carers to take time off work to care for the child in the 2 years following the child's birth or adoption
- enhance the health and development of birth mothers and children
- encourage women to continue to participate in the workforce
- promote equality between men and women, and the balance between work and family life
- provide those carers with greater flexibility to balance work and family life.
It is important to note that these objectives can be in conflict or tension with each other and that the weight given to each may vary as policy develops to reflect changing family and economic trends and needs. Analysis of international trends in parental leave policy design show that the objectives of parental leave policies are shifting from a maternalist to an economic and labour market orientation (Dobrotic & Blum, 2020) especially with regard to encouraging female workforce participation (Baird & O’Brien, 2015).
Use of the current scheme [2]
The design of the 18 week paid parental leave scheme introduced in 2010 focused on the primary carer. Dad and partner pay (DaPP), introduced three years later, was for the father or partner. Table 1 shows the scheme’s use matches this intent, with mothers using the parental leave pay and fathers/partners using the Dad and partner pay. For example, in 2018–2019 and 2019–2020, 99.5% of paid parental leave recipients were mothers. In 2013 Dad and partner pay was introduced to provide fathers/partners with a period of 2 weeks paid at the national minimum wage. This is used overwhelmingly by men.
Table 1. Paid parental leave recipients by gender
| Parental leave pay | Dad and partner pay | |||||||
|---|---|---|---|---|---|---|---|---|
| Year | Female | (%) | Male | (%) | Female | (%) | Male | (%) |
| 2011/2012 | 125026 | 99.35% | 798 | 0.63% | ||||
| 2012/2013 | 131478 | 99.42% | 765 | 0.58% | 92 | 0.34% | 27162 | 99.66% |
| 2013/2014 | 145317 | 99.48% | 766 | 0.52% | 289 | 0.38% | 75478 | 99.62% |
| 2014/2015 | 159449 | 99.47% | 844 | 0.53% | 289 | 0.41% | 70700 | 99.59% |
| 2015/2016 | 169889 | 99.55% | 769 | 0.45% | 343 | 0.43% | 79142 | 99.57% |
| 2016/2017 | 170129 | 99.53% | 796 | 0.47% | 374 | 0.45% | 83226 | 99.55% |
| 2017/2018 | 158583 | 99.50% | 789 | 0.50% | 372 | 0.45% | 81510 | 99.55% |
| 2018/2019 | 177882 | 99.51% | 876 | 0.49% | 465 | 0.51% | 91297 | 99.49% |
| 2019/2020 | 170837 | 99.49% | 875 | 0.51% | 467 | 0.51% | 91876 | 99.49% |
Note: Unknowns have been included in the ‘Male’ category.
Source: EDW Paid Parental Leave scheme Claims Universe, Data Load Version 2, as at 30 June each entitlement year.
Concurrency of use
Under the current scheme, concurrency or overlap of paid parental leave and Dad and partner pay days is low. For example, Table 2 shows that in 2019–2020, of the almost 172,000 recipients of paid parental leave (of whom 99.5% were mothers), there was an overlap of the full period of Dad and partner pay days (that is taken with the partner) in just 34,354 cases.
Table 2. Paid parental leave recipients who have an overlapping DaPP period for the same child
| Period Overlap Indicator | Number of Days | 2011/2012 | 2012/2013 | 2013/2014 | 2014/2015 | 2015/2016 | 20162017 | 2017/2018 | 2018/2019 | 2019/2020 |
|---|---|---|---|---|---|---|---|---|---|---|
| OVERLAP | 1 | 79 | 236 | 203 | 223 | 252 | 247 | 255 | 243 | |
| 2 | 72 | 235 | 185 | 197 | 250 | 200 | 217 | 217 | ||
| 3 | 85 | 225 | 243 | 211 | 245 | 213 | 199 | 222 | ||
| 4 | 105 | 244 | 218 | 237 | 192 | 212 | 228 | 225 | ||
| 5 | 83 | 233 | 208 | 230 | 218 | 186 | 200 | 191 | ||
| 6 | 100 | 272 | 238 | 276 | 232 | 226 | 252 | 223 | ||
| 7 | 211 | 565 | 493 | 570 | 579 | 545 | 554 | 559 | ||
| 8 | 97 | 280 | 248 | 255 | 269 | 223 | 240 | 276 | ||
| 9 | 89 | 231 | 202 | 211 | 253 | 208 | 225 | 222 | ||
| 10 | 95 | 274 | 258 | 220 | 222 | 198 | 250 | 233 | ||
| 11 | 71 | 230 | 208 | 224 | 234 | 206 | 243 | 241 | ||
| 12 | 58 | 217 | 208 | 260 | 184 | 230 | 220 | 226 | ||
| 13 | 69 | 227 | 219 | 231 | 249 | 272 | 282 | 304 | ||
| 14 | 9738 | 25871 | 25380 | 29366 | 31892 | 30306 | 35672 | 34354 | ||
| NO OVERLAP | 0 | 125824 | 121291 | 116743 | 131782 | 137947 | 135654 | 125900 | 139721 | 133976 |
| Total | 125824 | 132243 | 146083 | 160293 | 170658 | 170925 | 159372 | 178758 | 171712 | |
Note: Where entitlement period end dates occurred outside the entitlement year the projected end date has been used. Retrospective changes may have been applied that will not have been captured due to the report date.
Source: EDW Paid Parental Leave scheme, Claims Universe, Data Load Version 2, as at 30 June each entitlement year.
Flexibility of use
The policy was amended in 2020 [3] to allow flexible use of paid leave days. Table 3 shows flexibility of use. Of total cases, 86% have not used leave in a flexible way, 10% used the flexible option and for the remaining 4% the flexible option is still underway. For those who do choose to use the flexible option, they access less of their full 18-week paid parental leave entitlement overall. In 2021–22 this was almost 11 weeks. Under the current scheme, there is also a very low rate of transfer to a secondary claimant.
Table 3. Paid parental leave recipients (under flexible PPS) as at 30 September 2023
| PARTICIPATION | 2021–22 | |||
PLP choices made for children born on or after 1 July 2020 | Consecutive 18 week period (finished) | 153,084 | 85.70% | |
| Consecutive 18 week period (still on) | 7,423 | 4.20% | ||
Received PLP Period and/or Flexible PPL | Flexible completed | 7,967 2,972 6,184 | ||
| Flexible commenced | ||||
| Total | Flexible notstarted | |||
| Grand Total | PLP opted for flexible PPL | 17,123 | 9.60% | |
| PLP recipients | 178,556 | |||
| Average PLP period duration | 10.6 weeks | |||
| Transfers to secondary claimant | PLP period – Full transfer | 274 | ||
| PLP period – Partial transfer | 311 | |||
| TOTAL transfers PLP period | 585 | |||
| Flexible commenced/completed | n.p. | |||
| Permission given not started | <5 | |||
| Total | Taken/available PPL Flexible | 522 | ||
Source: Provided by Services Australia, Data Load Version; N/A.
[1] Act reference: PPL Act Part 1-1 Division 1A Objects of this Act
[2] The authors thank staff of the Department of Social Services for providing the data used in this report.
[3] https://www.apsc.gov.au/circulars-and-advices/circular-20208-changes-parental-leave-pay-improve-flexibility
