PM&C is committed to achieving gender equity which includes ensuring our staff receive equal pay for equal work, regardless of gender. To review whether the department is meeting this commitment, we analyse gendered remuneration annually using data and outcomes from the APS Remuneration Survey, the source of data for the APS Remuneration Report, an annual snapshot of remuneration across the Australian Public Service.
The most recent survey data, shows that PM&C’s gender pay gap was 2.2% at December 2023, a 4 percentage point reduction from 2022 and 2.3 percentage points below the overall APS rate of 4.5%. This is based off the Australian Public Service’s (APSC’s) primary gender pay gap calculation using an average (mean) base salary metric.
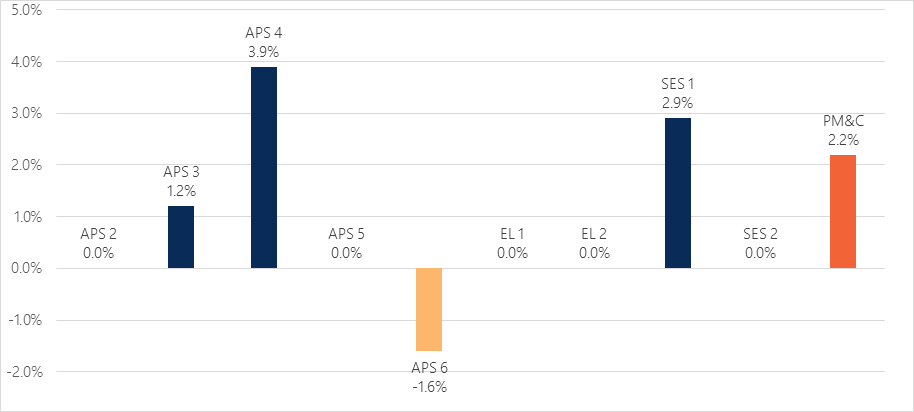
PM&C continues to have no, or negligible, gender pay gap at the majority of classification levels. This indicates that women and men undertaking work of similar value are remunerated relatively equally (Figure 1 and Table 1). For example, at the SES B1 level, the gender pay gap is 2.9%, meaning men are paid slightly more than women.
Figure 1 – PM&C gender pay gap by substantive classification – December 2023*

*The gender pay gap at the APS 1 and SES B3 level is excluded from the figure one and table one, due to the very small number of staff in each cohort (<10). However, these employees contribute to the overall PMC gender pay gap. The Secretary has been excluded.
Table 1 – PM&C gender pay gap by substantive classification – December 2023
| Substantive classification | Gender Pay Gap |
|---|---|
| APS 2 | 0.0% |
| APS 3 | 1.2% |
| APS 4* | 3.9% |
| APS 5 | 0.0% |
| APS 6 | -1.6% |
| EL 1 | 0.0% |
| EL 2 | 0.0% |
| SES B1 | 2.9% |
| SES B2 | 0.0% |
| PM&C | 2.2% |
*For the APS 4 gender pay gap result it should be noted there are small numbers in the cohort, particularly men, where only 2 individuals contributed to the result.
Gender distribution
PM&C’s gender pay gap is largely driven by the distribution of women and men across the classifications. In 2023, for example, women made up 68% of all PM&C employees, and 62% of all SES. In 2022, when PM&C’s gender pay gap was 6.2%, women made up 68% of all employees but only 57% of all SES. This under representation of women at higher levels, although trending in the right direction, results in an overall lower average female salary compared with the average male salary. Due to PM&C’s size, individual SES salaries can also influence the gender pay gap. Positively, the narrowing of the gap at the SES level has contributed to the gender pay gap improvement between 2022 and 2023.
Given the gender pay gap at the classification levels is relatively low, the larger proportion of females at the lower classifications is the main driver behind the 2.2% organisational pay gap (see Figure 2 and Table 2). The larger proportion of women at lower classifications makes the average female salary lower. A lower average female salary results in a gender pay gap.
Figure 2 – Proportion of women and men at each substantive classification, December 2023

Table 2 – Proportion of women and men at each substantive classification, December 2023
| Substantive classification | Women | Men |
|---|---|---|
| APS 1-3 | 3% | 5% |
| APS 4 | 6% | 3% |
| APS 5 | 12% | 10% |
| APS 6 | 23% | 23% |
| EL 1 | 34% | 33% |
| EL 2 | 15% | 16% |
| SES | 6% | 7% |
Trends
The distribution of the genders across all classifications is slowly evening out, reducing the organisational gender pay gap over recent years. This includes the proportion of female SES which has risen from 51% in December 2020, 54% in December 2021, 55% in December 2022 and 62% in December 2023. This has influenced the downward trend in the gender pay gap from 7.4% in 2020 to 6.3% in 2021, 6.2% in 2022 and now 2.2% in 2023.
What next
PM&C will continue efforts to close the pay gap through a number of levers, including initiatives within the PM&C Inclusion and Diversity Strategy 2023-26. Our policies, strategies and activities are well placed to support the 6 Workplace Gender Equality Agency (WGEA) Gender Equality Indicators and alignment with the APS Gender Equality Strategy 2021-26.
This includes all aspects of our modern and attractive employment framework which supports people of all genders and backgrounds to participate at PM&C and remove barriers to career progression, such as flexible work, parental leave, breastfeeding entitlements, a transparent performance framework and annual pay advancement (including for eligible employees on parental leave).
PM&C’s existing classification salary bands provide parameters to control gender pay inequity. Within the bands, men and women may be paid at different pay-points dependant on levels of skills and experience, usually commencing at the lowest pay point on promotion or engagement then moving up each year.
PM&C is proud of its employee-led Gender Equality Network that champions for equal opportunity and gender equality, supporting all employees to succeed in their professional and personal lives. Like with all PM&C Employee Networks, the Gender Equality Network contributes to a culture where everyone feels valued, safe and included at work.
In early 2025 in line with requirements of the Workplace Gender Equality Act 2012, WGEA will release agency-level gender pay gap results. Unlike the APSC’s mean base salary metric, WGEA will use a median meaning their result will vary from the result presented here.
